.svg)

Role: Lead Product/UX Designer
Timeline: 14 months
Team: VP Ops · 1 PM · 5 Engineers · 1 Data Scientist · Individual Workstream teams
Platform: Web (responsive), Internal B2B
Tools: Figma, FigJam, Amplitude/GA, Miro
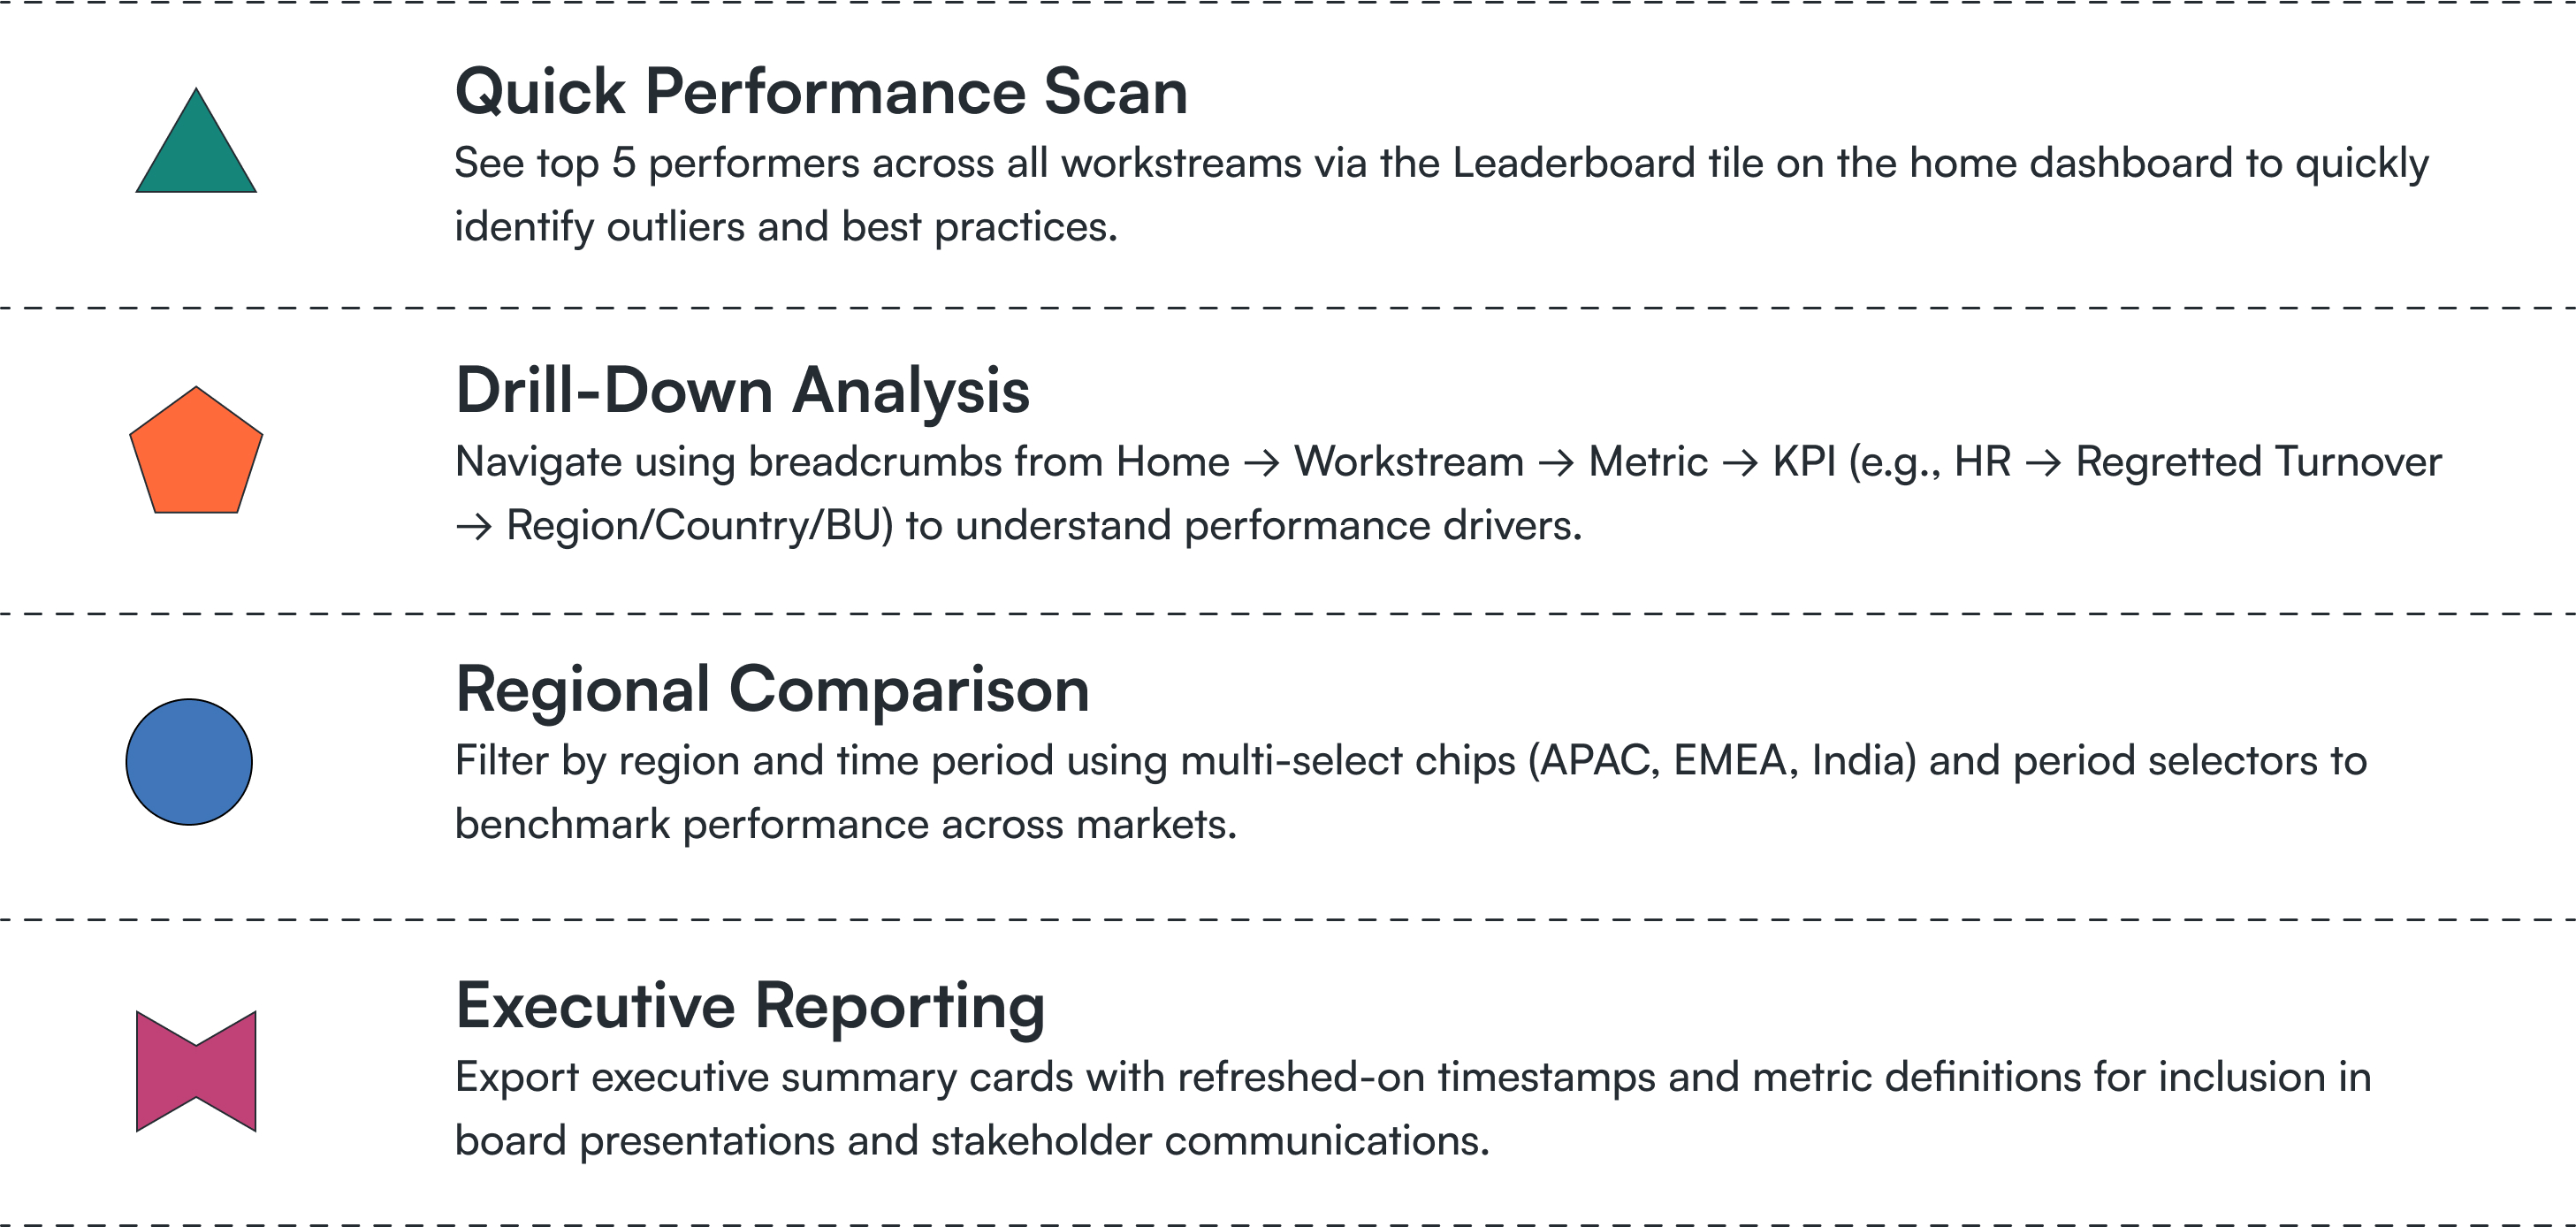
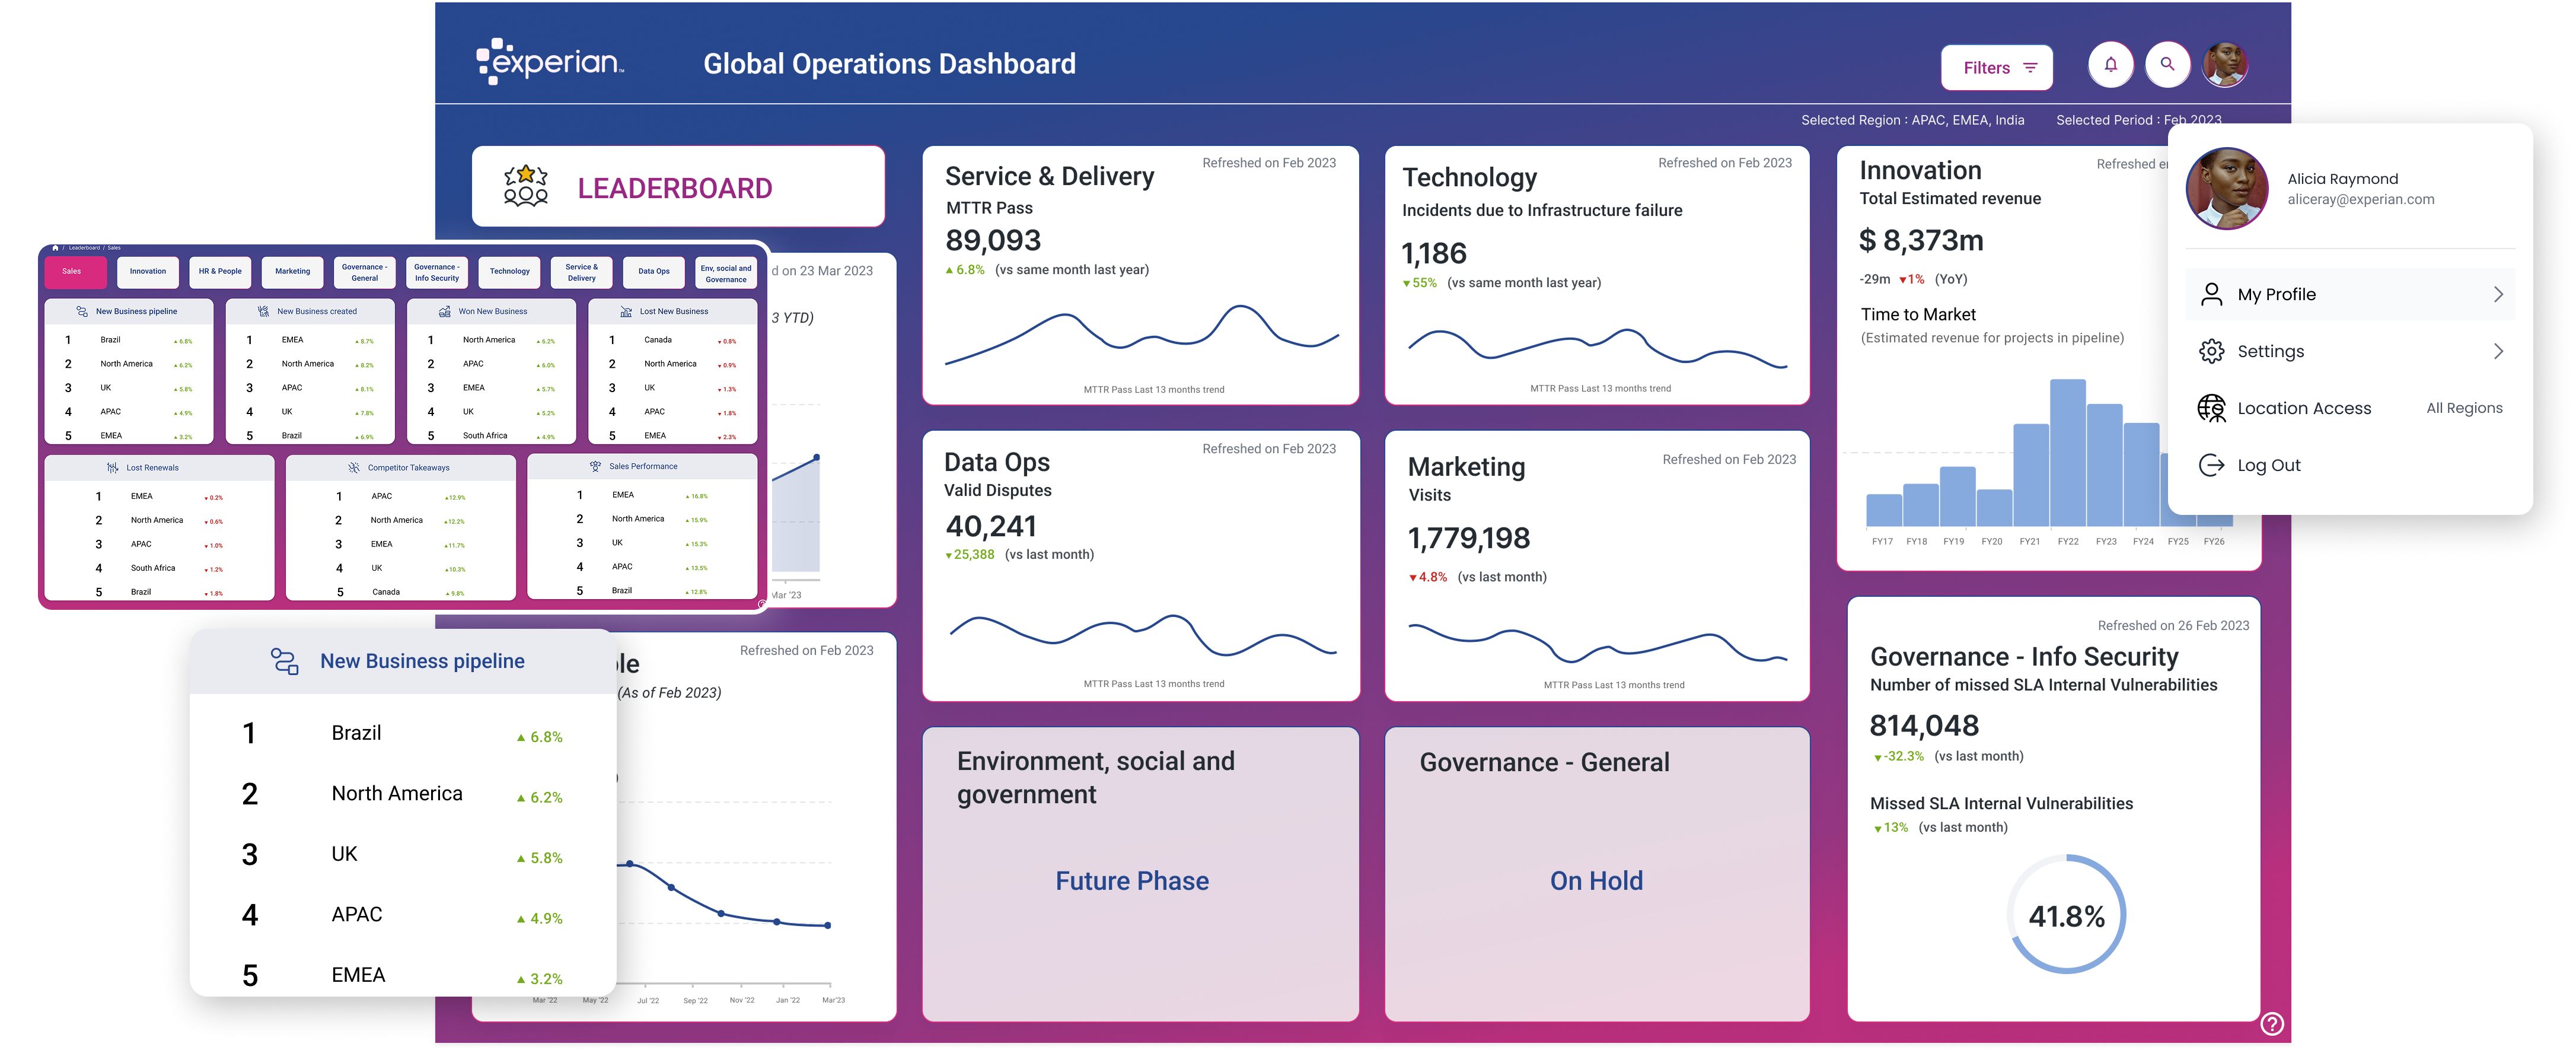
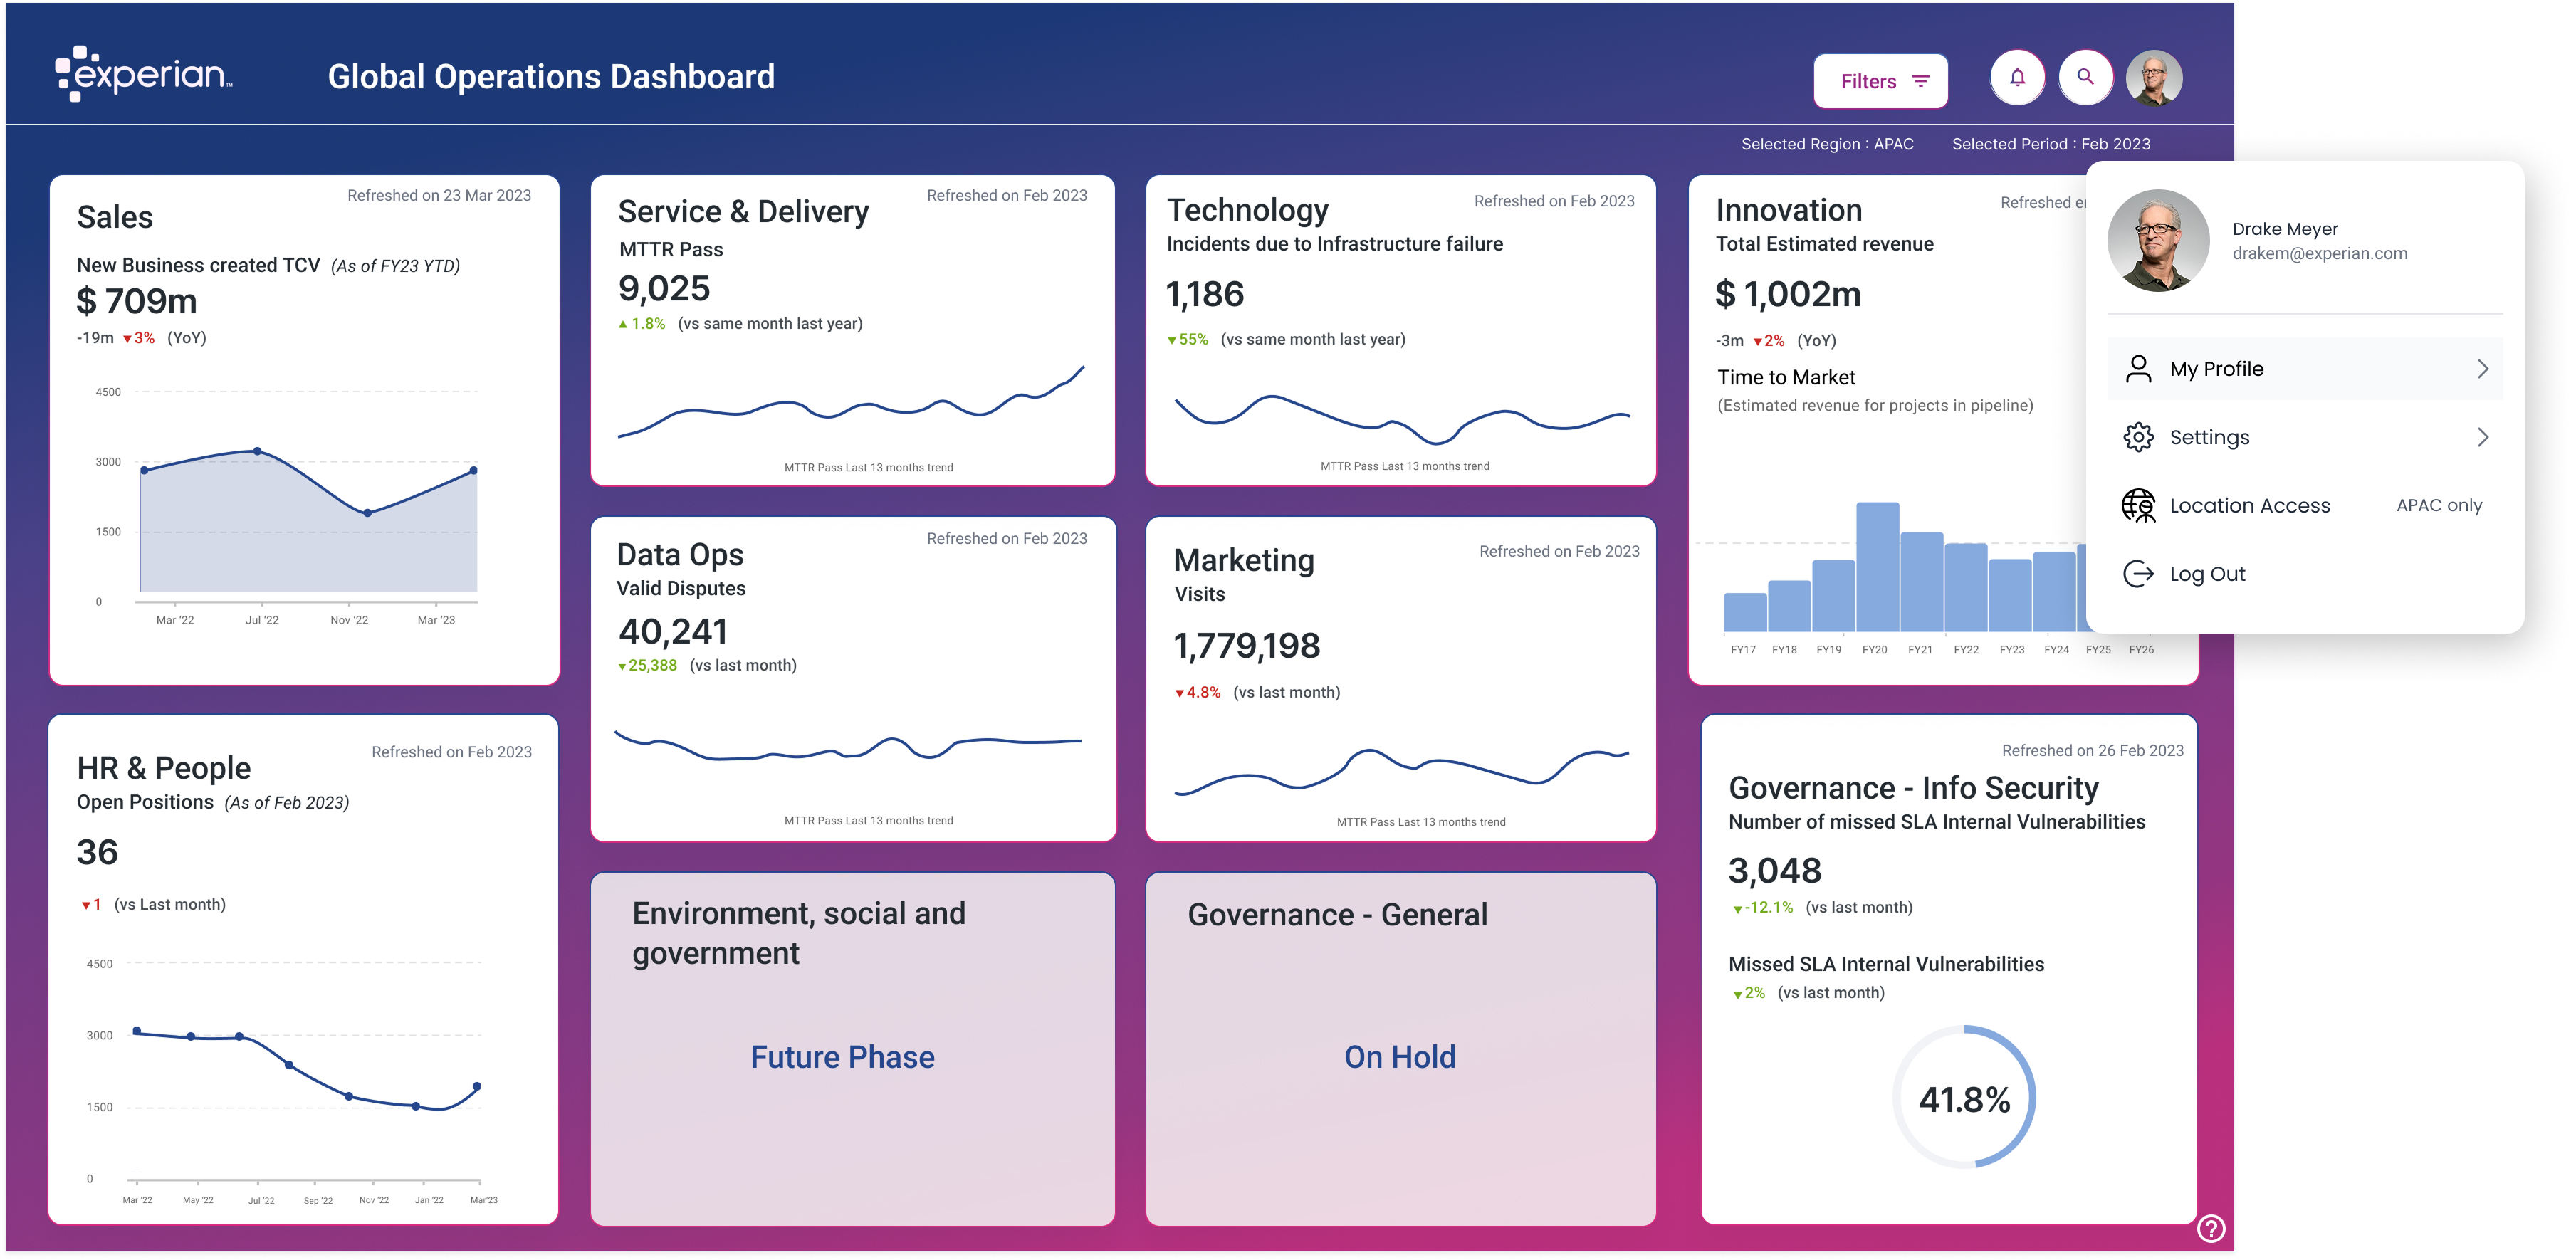
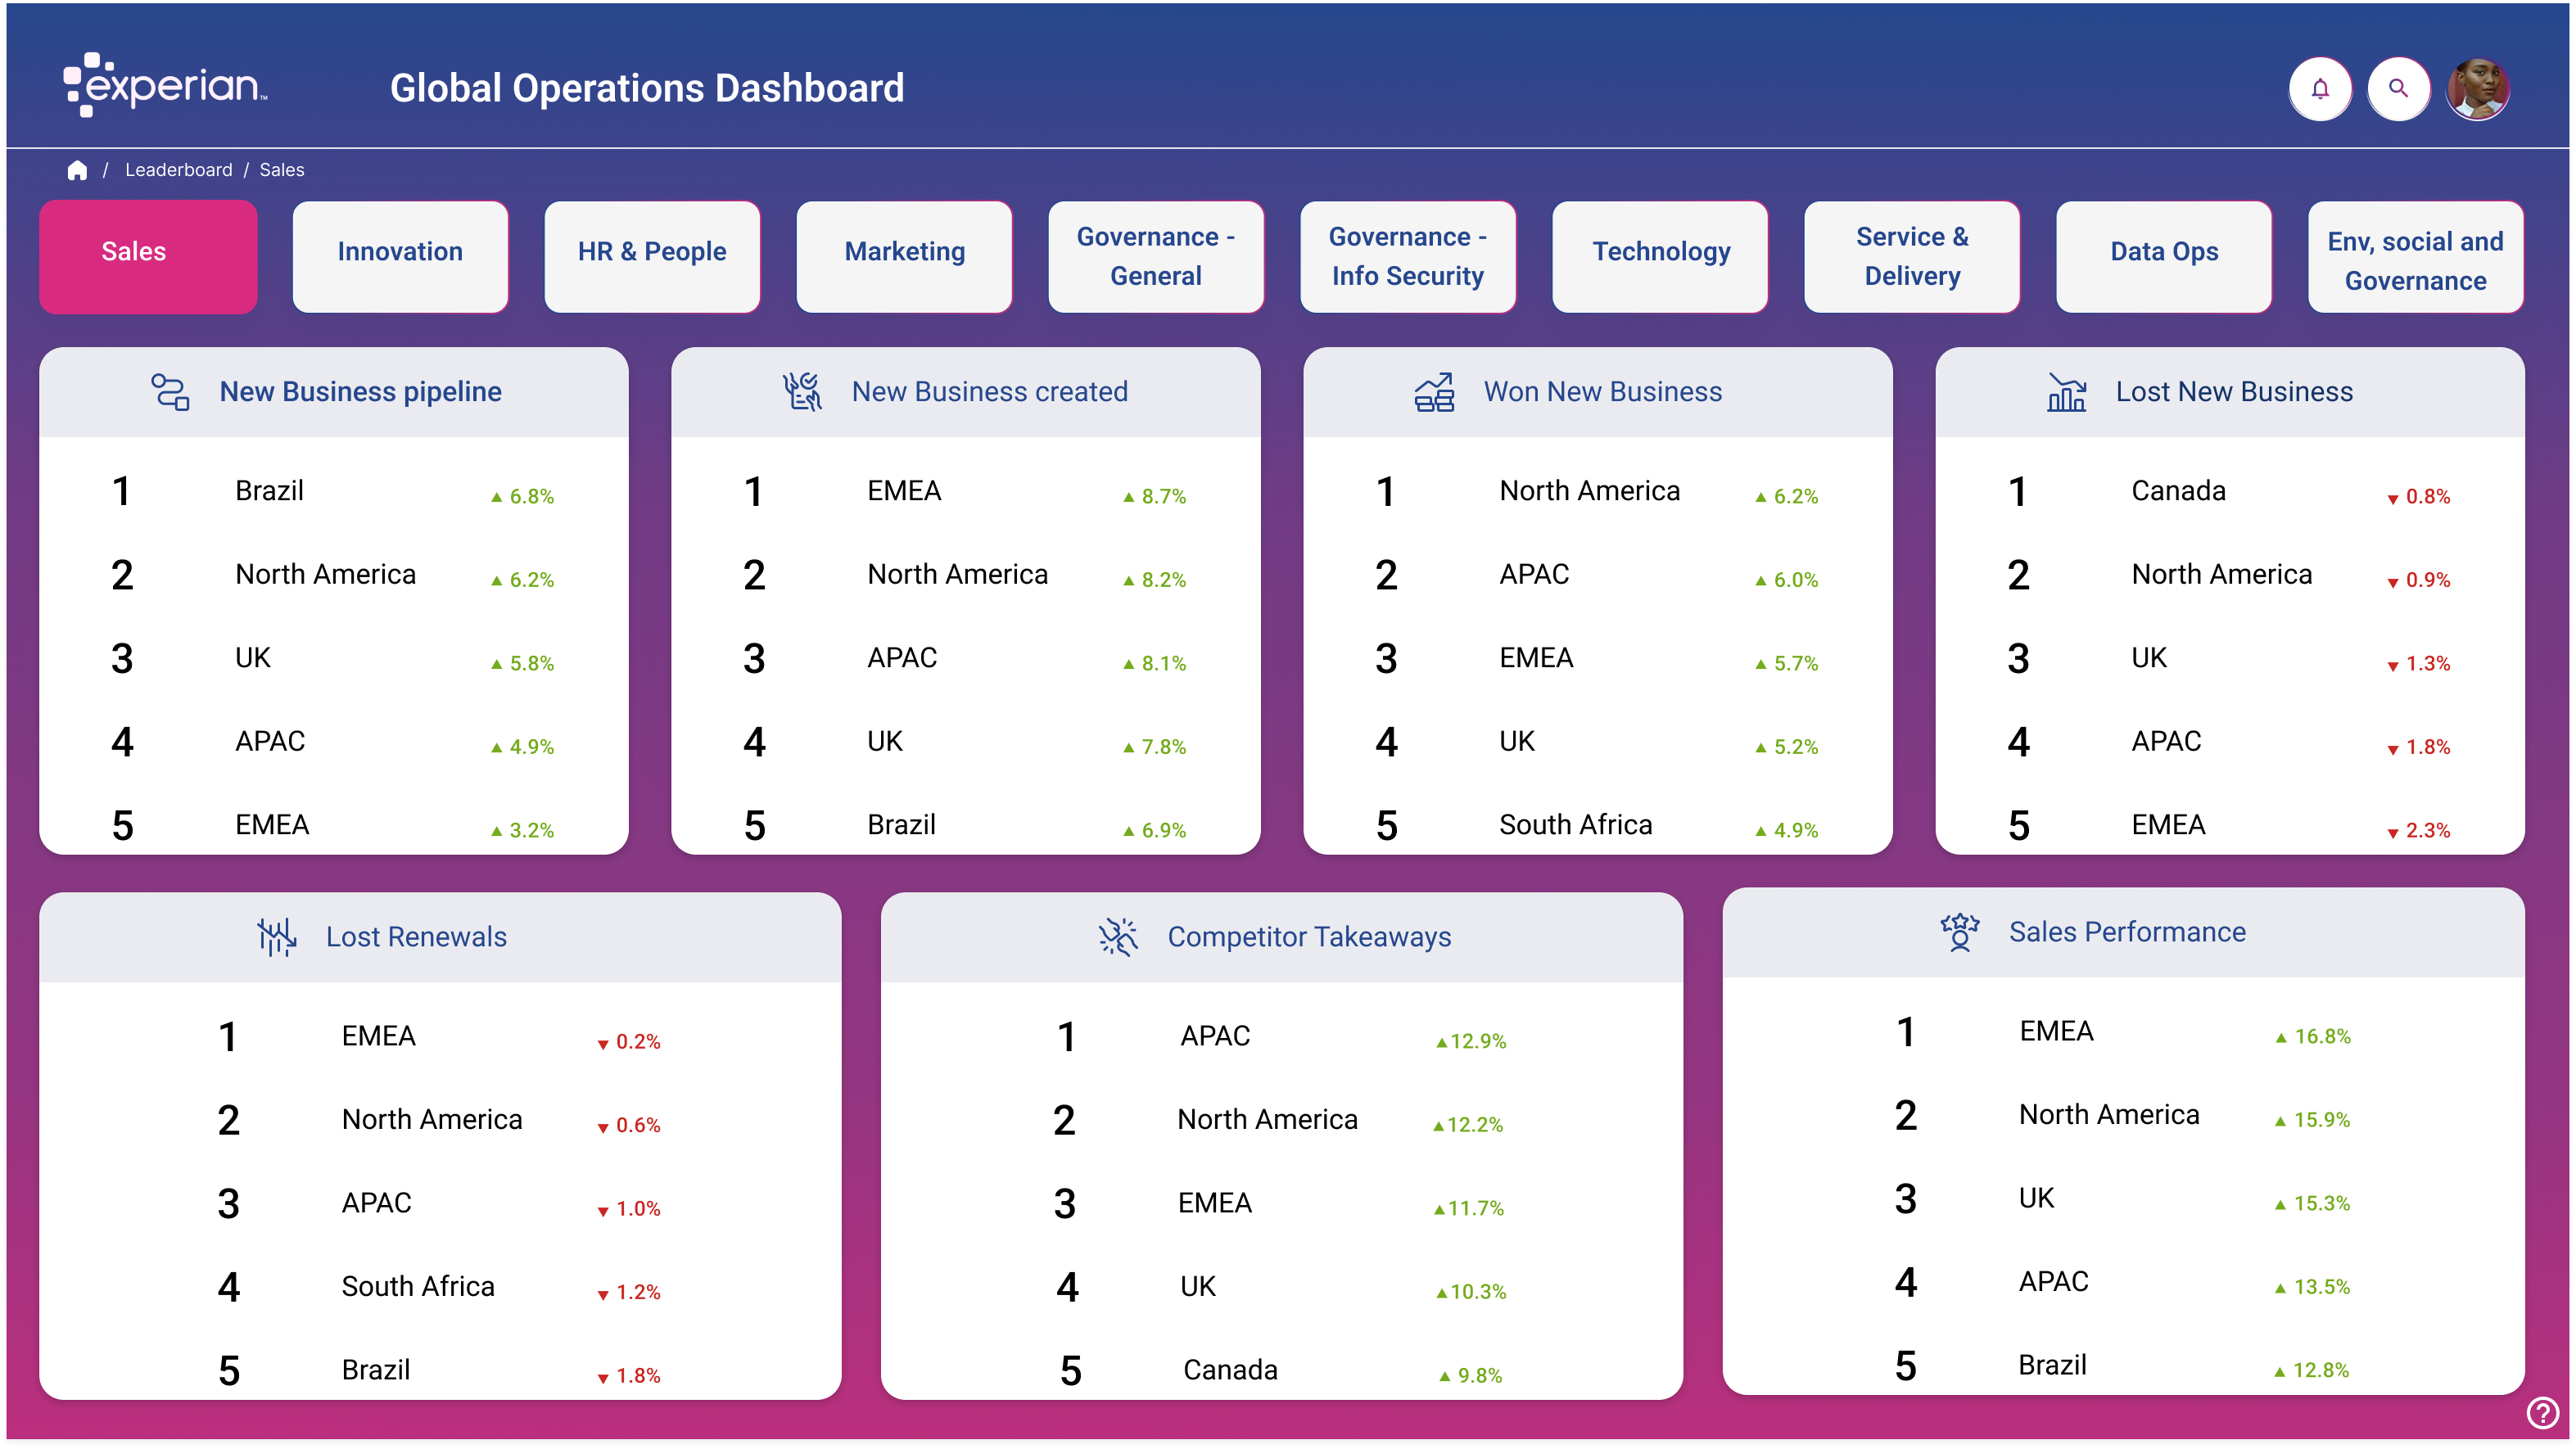
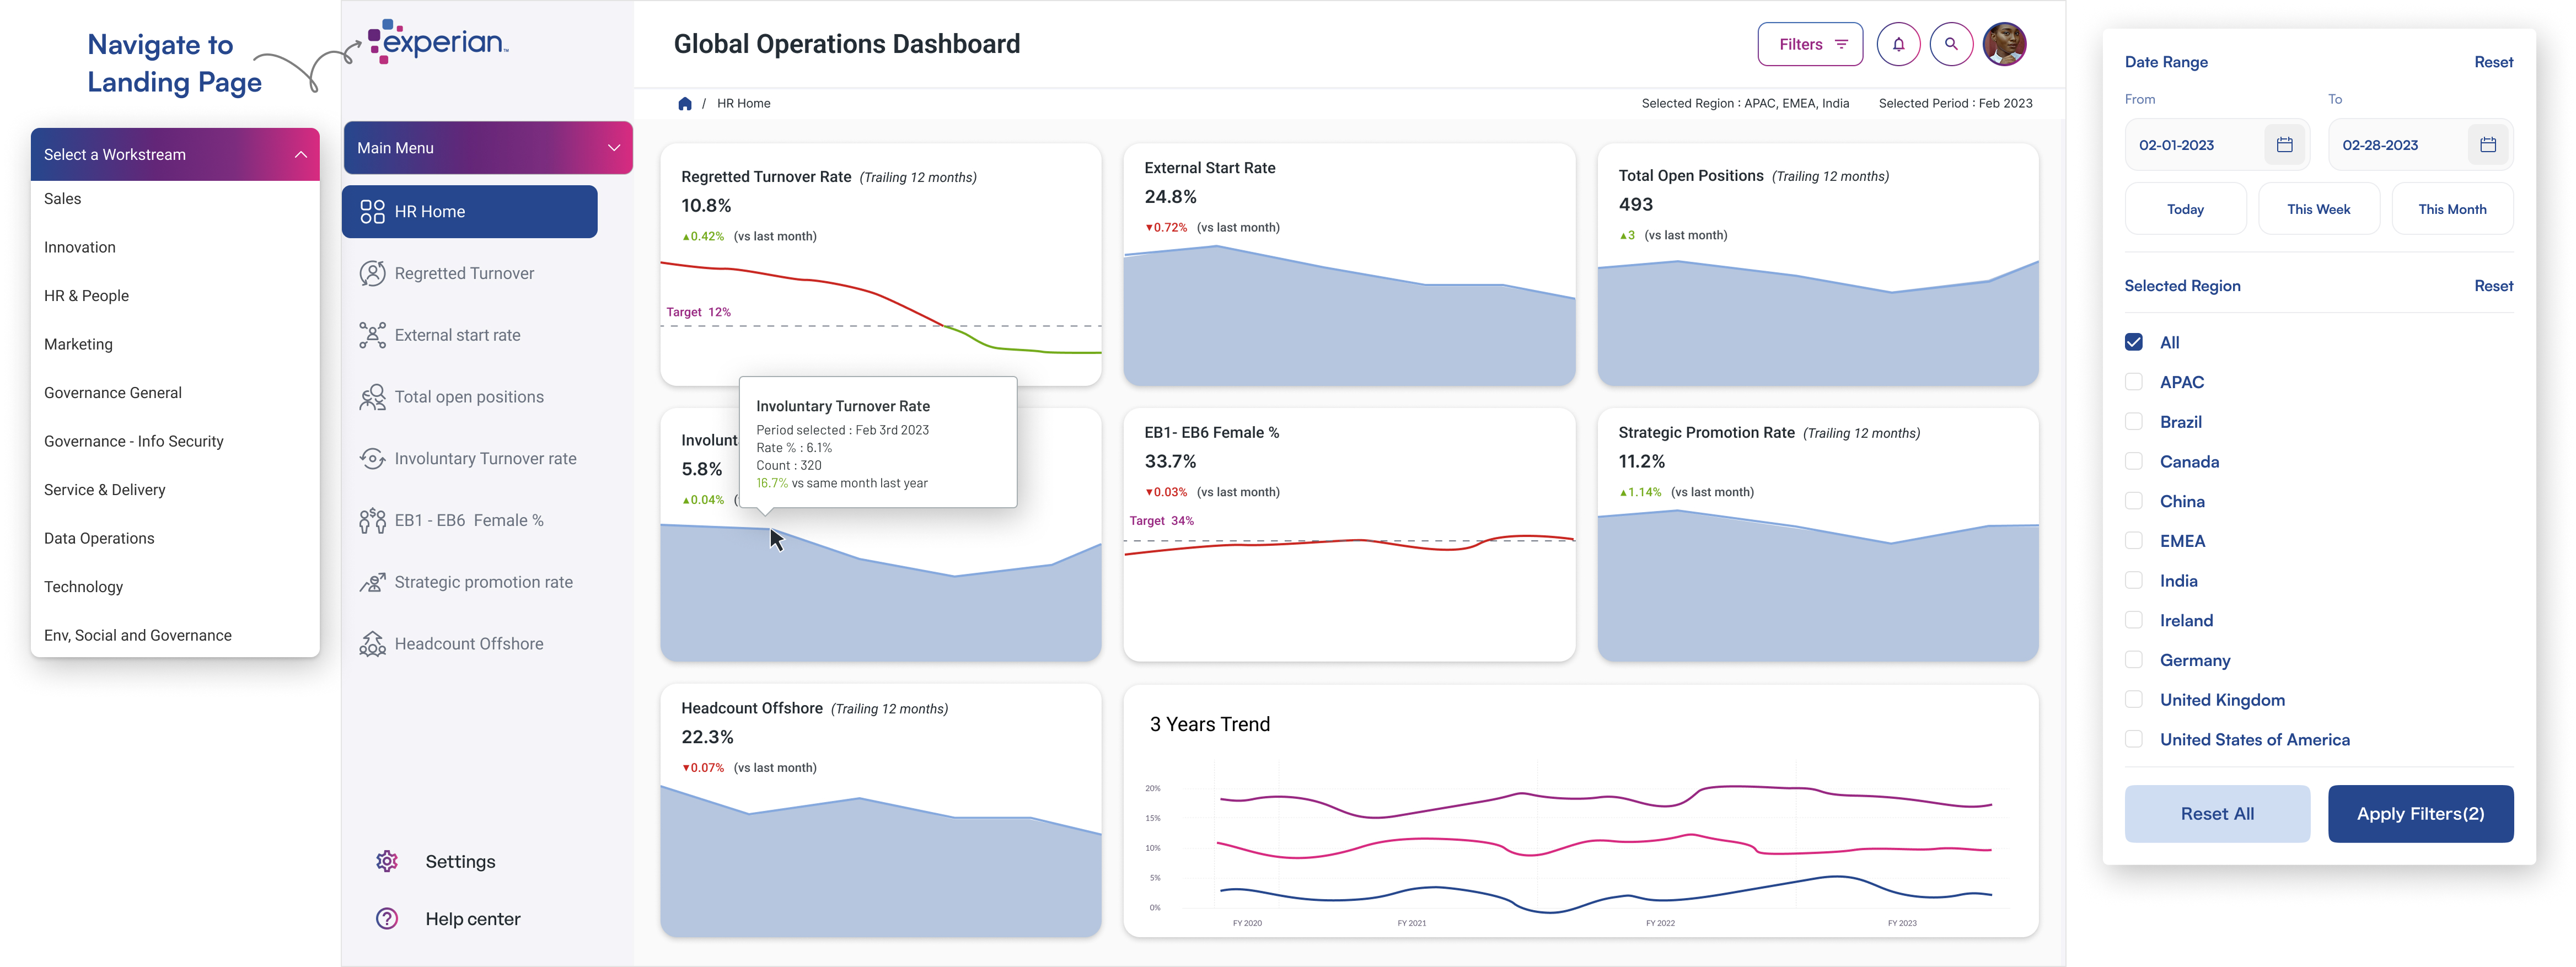
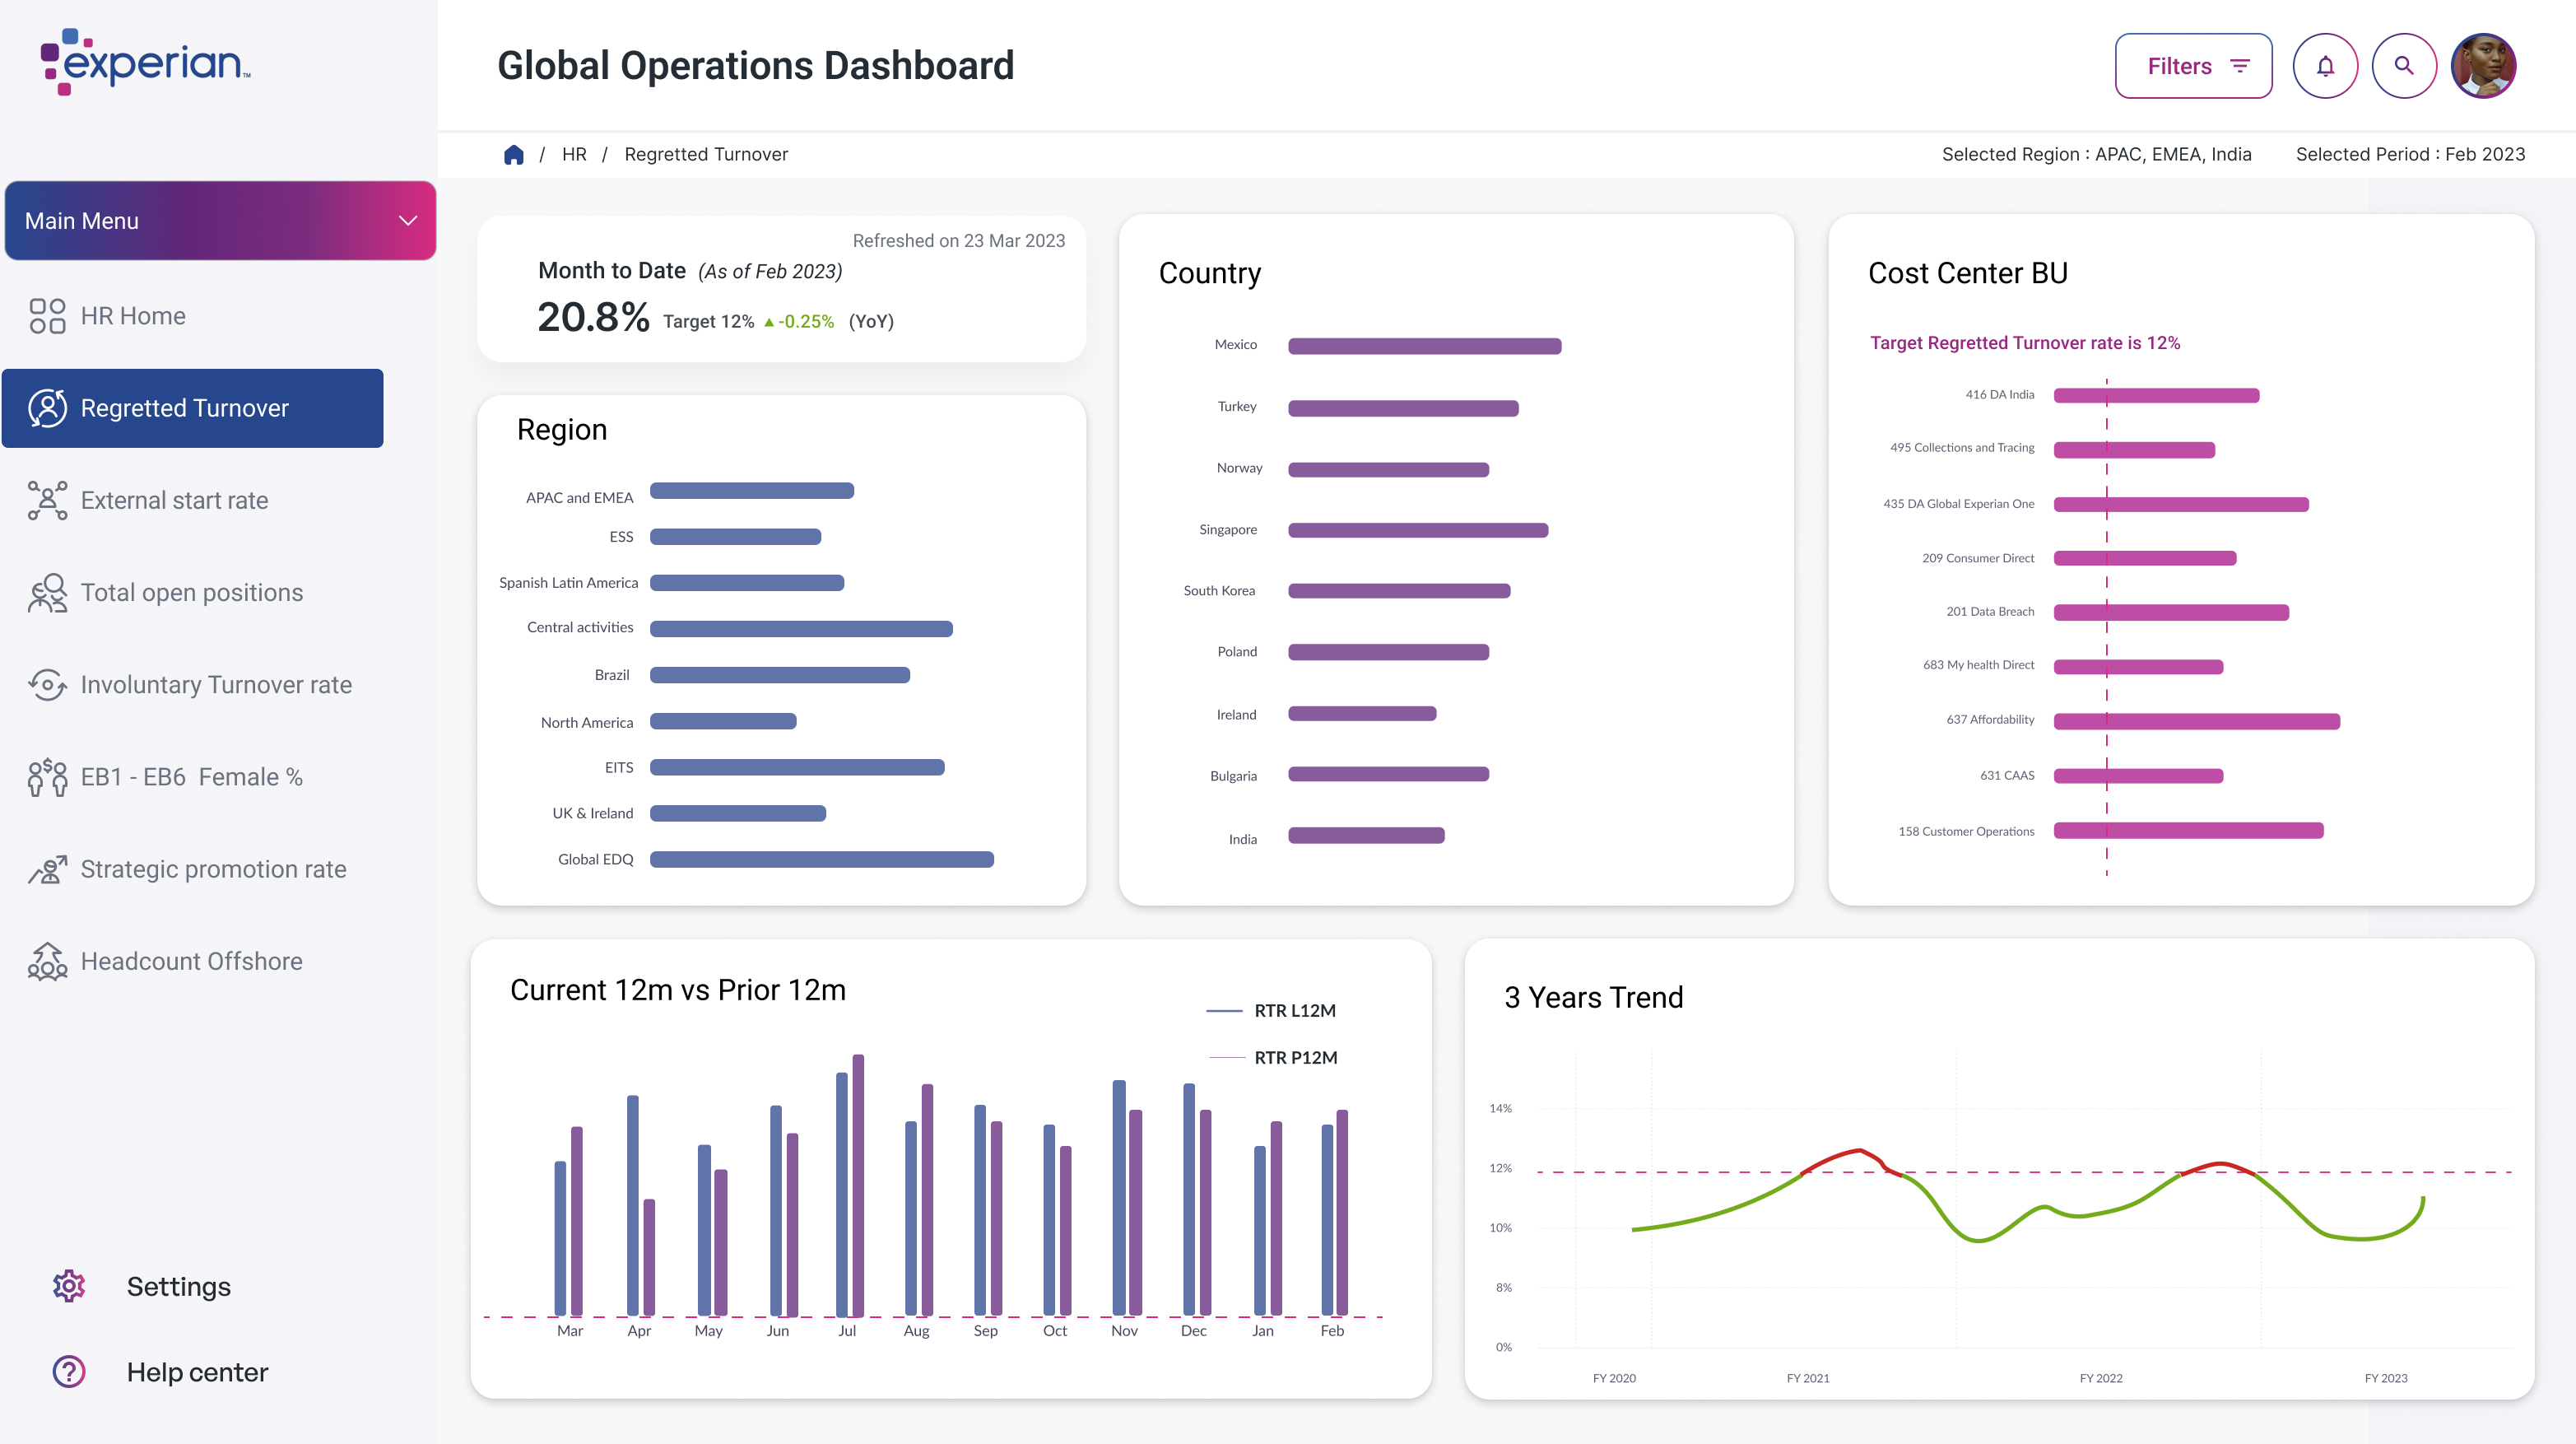
Designed a global operations dashboard for C‑suite executives as a single source of truth across 10 workstreams. Each workstream contains multiple metrics, and each metric rolls up into several KPIs. The app is user‑profile–based with role and regional access controls. A cross‑stream leaderboard surfaces the top 5 performances across all streams and metrics to spotlight outliers and best practices.
.gif)
%2520-%2520Pencil%2520draw%2520design.png)
C-suite executives at Experian struggled with fragmented data across global operations, leading to inefficient decision-making and time-intensive reporting processes.
Weekly/ monthly reports were send to executives to analyze in the form of spreadsheets or powerpoint slides.
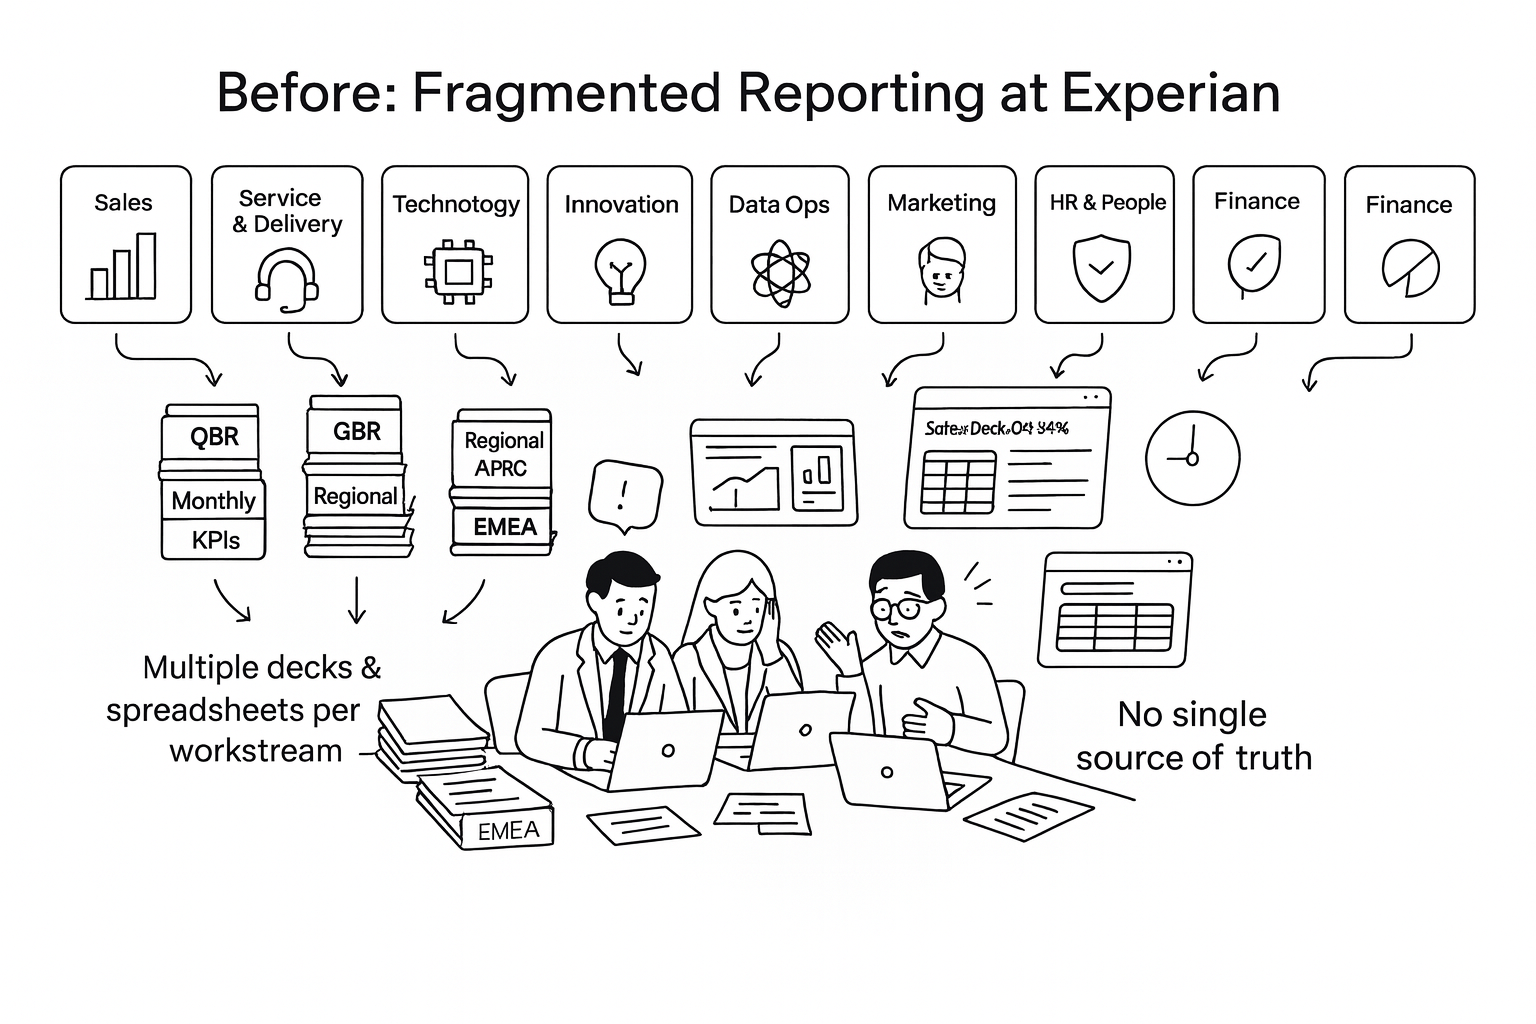
Business goals: Establish one reporting plane for C‑suite + regional leaders; drive weekly adoption; reduce prep time for ops reviews; enforce policy‑driven data access.
Our goal was to create a single, trusted reporting hub that lets C-suite and regional leaders grasp performance and act in under a ten minute taxi ride.

I conducted comprehensive stakeholder research to understand the complex needs of global executives and operational leaders. I had multiple discussions with different departments to understand that each of them had a different method of reporting.
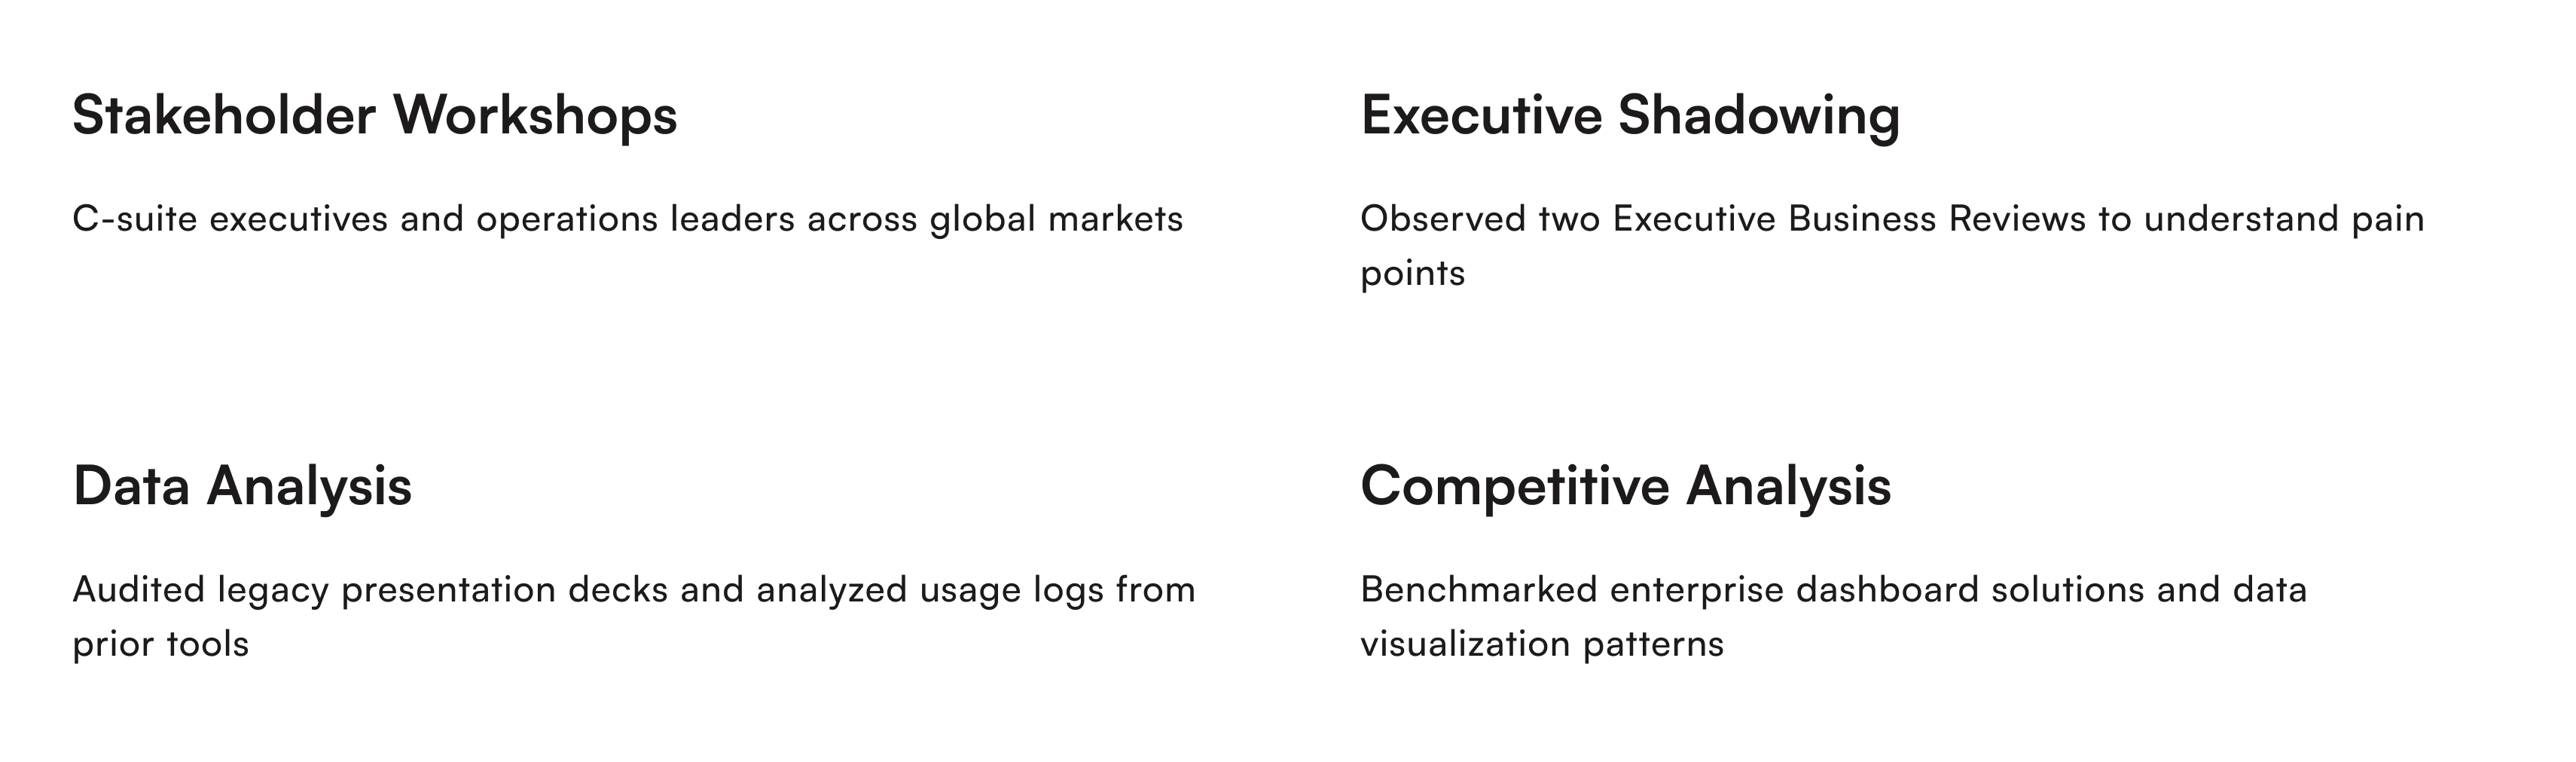
Key Insights:
%2520-%2520Admin%2520manager%2520person%2520personal%2520settings.png)
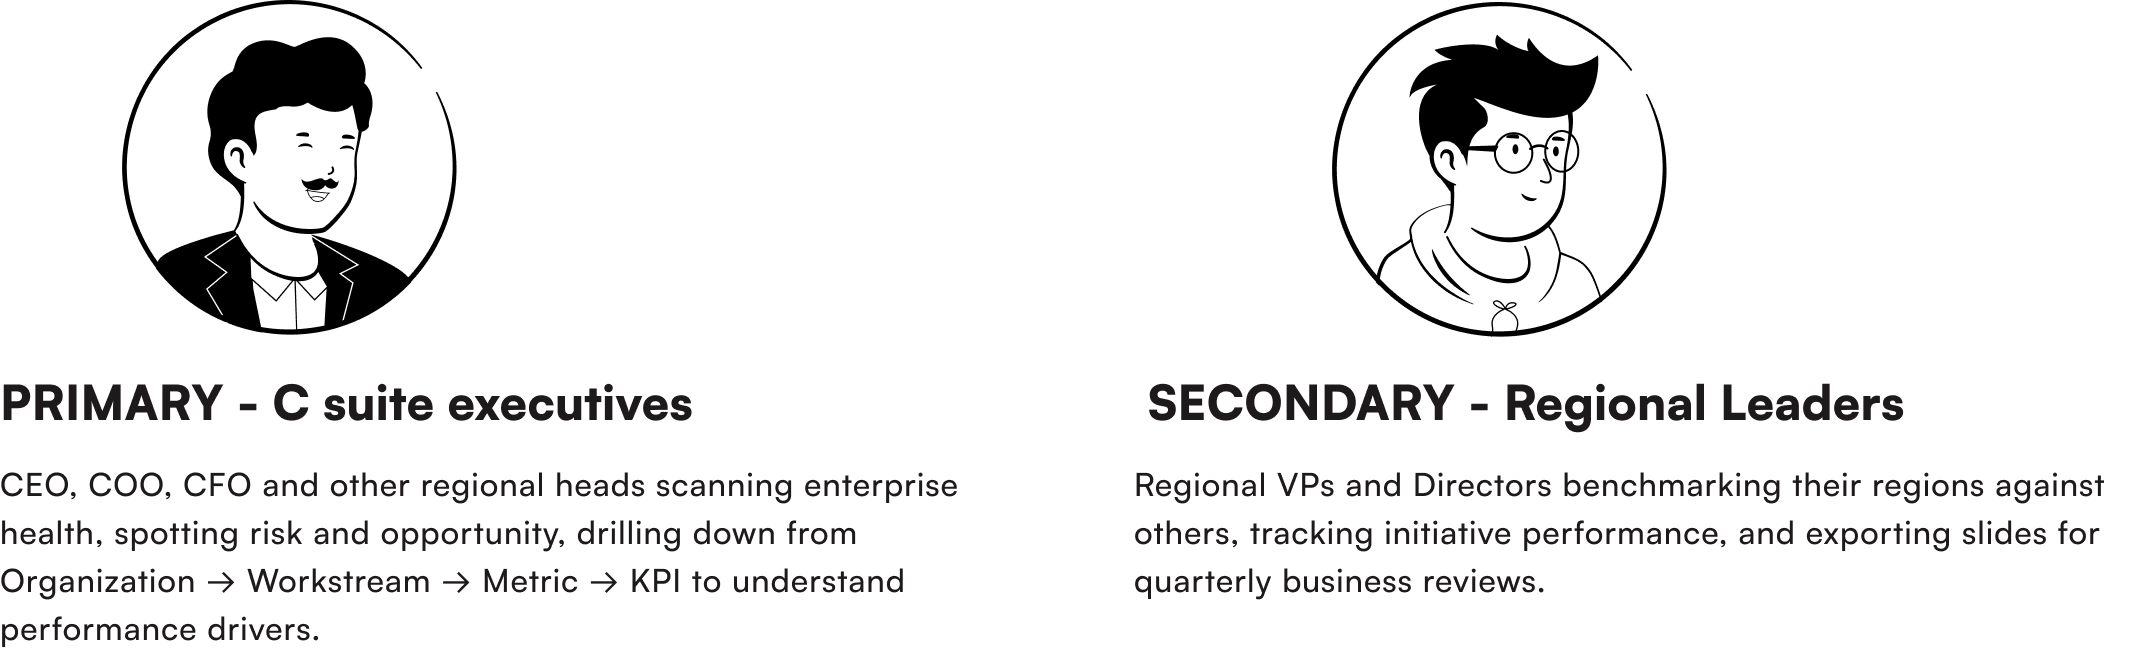
I identified two primary user groups with distinct but overlapping needs for performance visibility and decision support.
%2520-%2520Data%2520writing%2520job.png)
.gif)

The dashboard delivered significant improvements in executive productivity and decision-making efficiency across global operations.

The unified dashboard transformed how Experian's leadership team approaches global operations, enabling data-driven decisions with unprecedented speed and confidence
As Lead Product/UX Designer, I owned the end-to-end design process while collaborating closely with cross-functional stakeholders.


A case study redesigning website for PRIDEnet - the volunteer and community engagement sector of the PRIDE study.

A case study redesigning website for PRIDEnet - the volunteer and community engagement sector of the PRIDE study.
An optimization system for the Data and Analytics Team at Otsuka to track their development Operations activities
The client is a global pharmaceutical company that is committed to developing new treatments in neuroscience like schizophrenia and major depressive disorder (MDD), bipolar disorder, and other neurological and neuropsychiatric conditions, including Alzheimer disease, epilepsy, attention deficit hyperactive disorder, posttraumatic stress disorder, borderline personality disorder, and autism.
Develop a robust data optimization framework for the Data and Analytics Team at Otsuka to standardize their Dashboards and make them more accessible.
Project Manager , Developers (15) Scrum Master, Business Analyst, Data Scientist, Data Tech and Analytic Solution (DTAS) Team,
Global Intelligence Team(GCI)