.svg)
Project: Clinical Trial Patient Monitoring Application
Duration: 6 months (March 2023 - September 2023)
My Role: Senior Product Designer
Team: Product Manager, 4 Designers, 15 Developers, Data Scientist, Clinical Research Coordinator
A global healthcare company that develops and markets a wide range of pharmaceutical products across various therapeutic areas. With a primary focus on Neuroscience, Nephrology and Digital Innovation Products, the company places a strong emphasis on research and development to create innovative and impactful healthcare solutions.

During clinical trials for anxiety and depression treatments, patients and healthcare professionals often struggle with inefficient communication and data tracking. Patients need an intuitive way to log symptoms and side effects, while medical professionals require real-time insights to make informed decisions. This project aimed to design a seamless system for patients and healthcare professionals, bridging these gaps and improving clinical trial outcomes.
A comprehensive digital platform connecting patients and providers through intelligent design.
%2520-%2520Pencil%2520draw%2520design.png)
Patients struggling with anxiety and depression face additional challenges during clinical trials - inconsistent symptom tracking, poor communication with providers, and uncertainty about their progress. Healthcare providers manage multiple patients with fragmented data access, making it difficult to provide timely interventions and ensure trial success.

Methodology: Conducted surveys and in-depth interviews with patients participating in clinical trials, alongside consultations with healthcare providers.

Patients:
Struggled to track symptoms consistently, report side effects accurately, and communicate effectively with healthcare providers.
Medical Professionals:
Faced challenges in accessing real-time patient data, monitoring symptoms over time, and ensuring medication adherence.
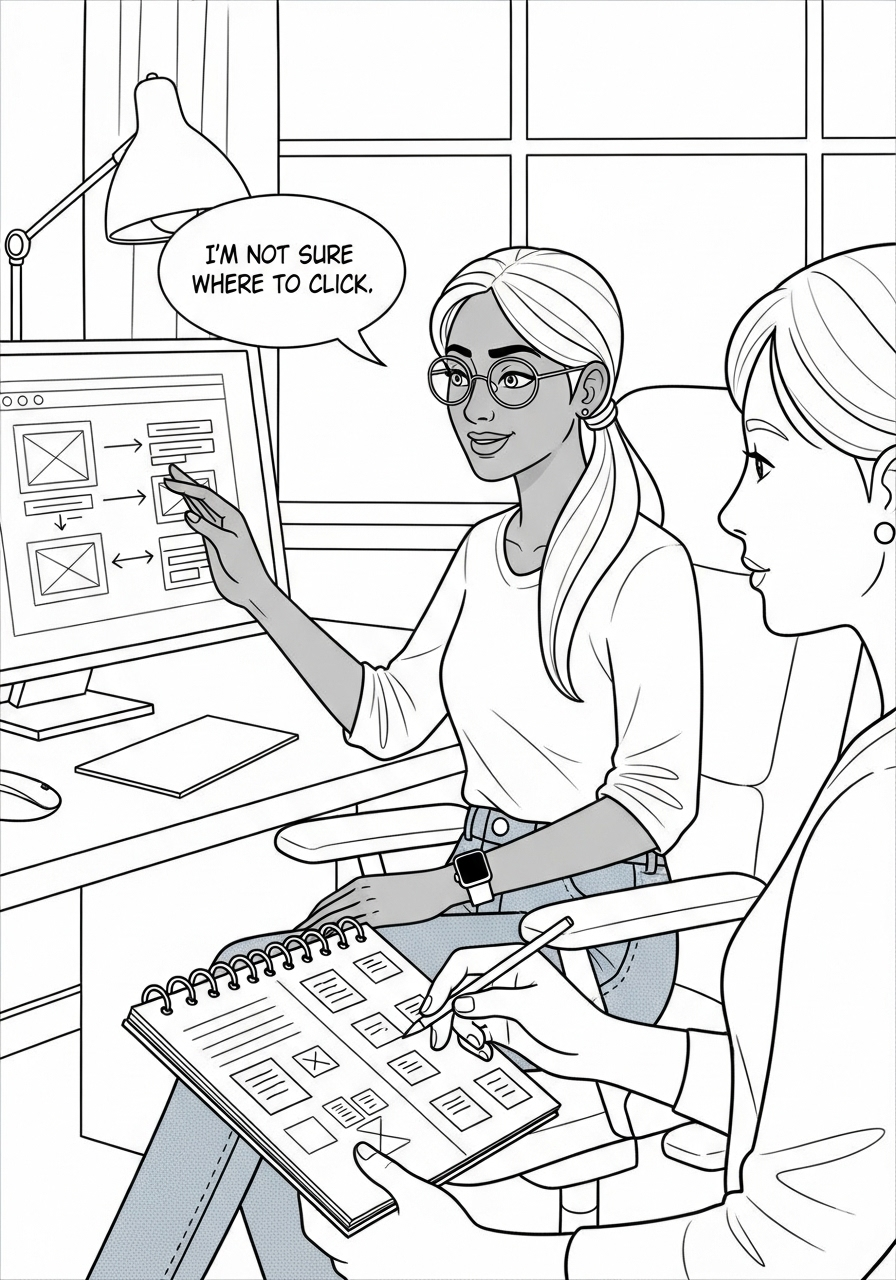
Mapped user journeys to identify major pain points and opportunities for streamlined interaction. The goal was to minimize friction in symptom logging for patients and optimize workflow efficiency for medical professionals.

%2520-%2520Data%2520writing%2520job.png)
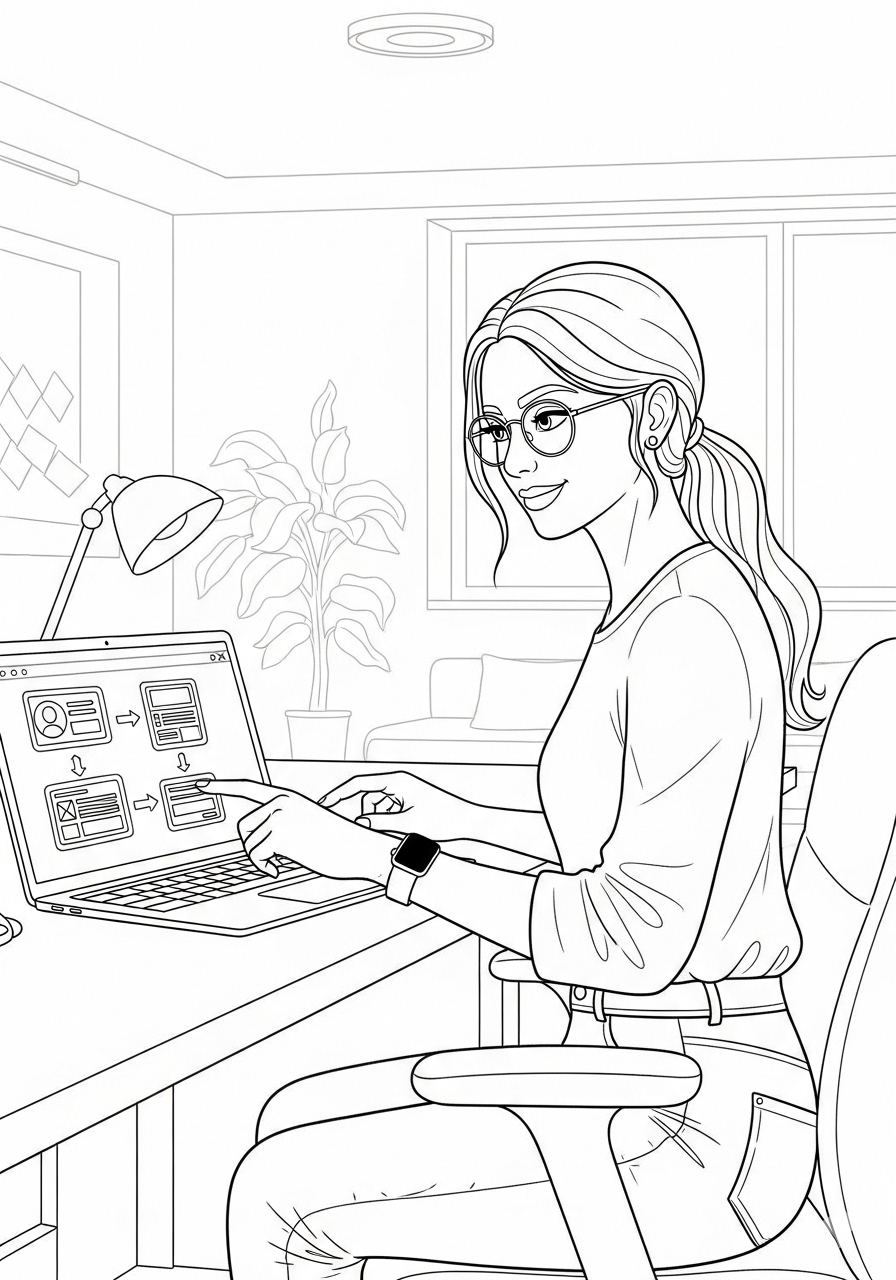
Wireframing & Prototyping
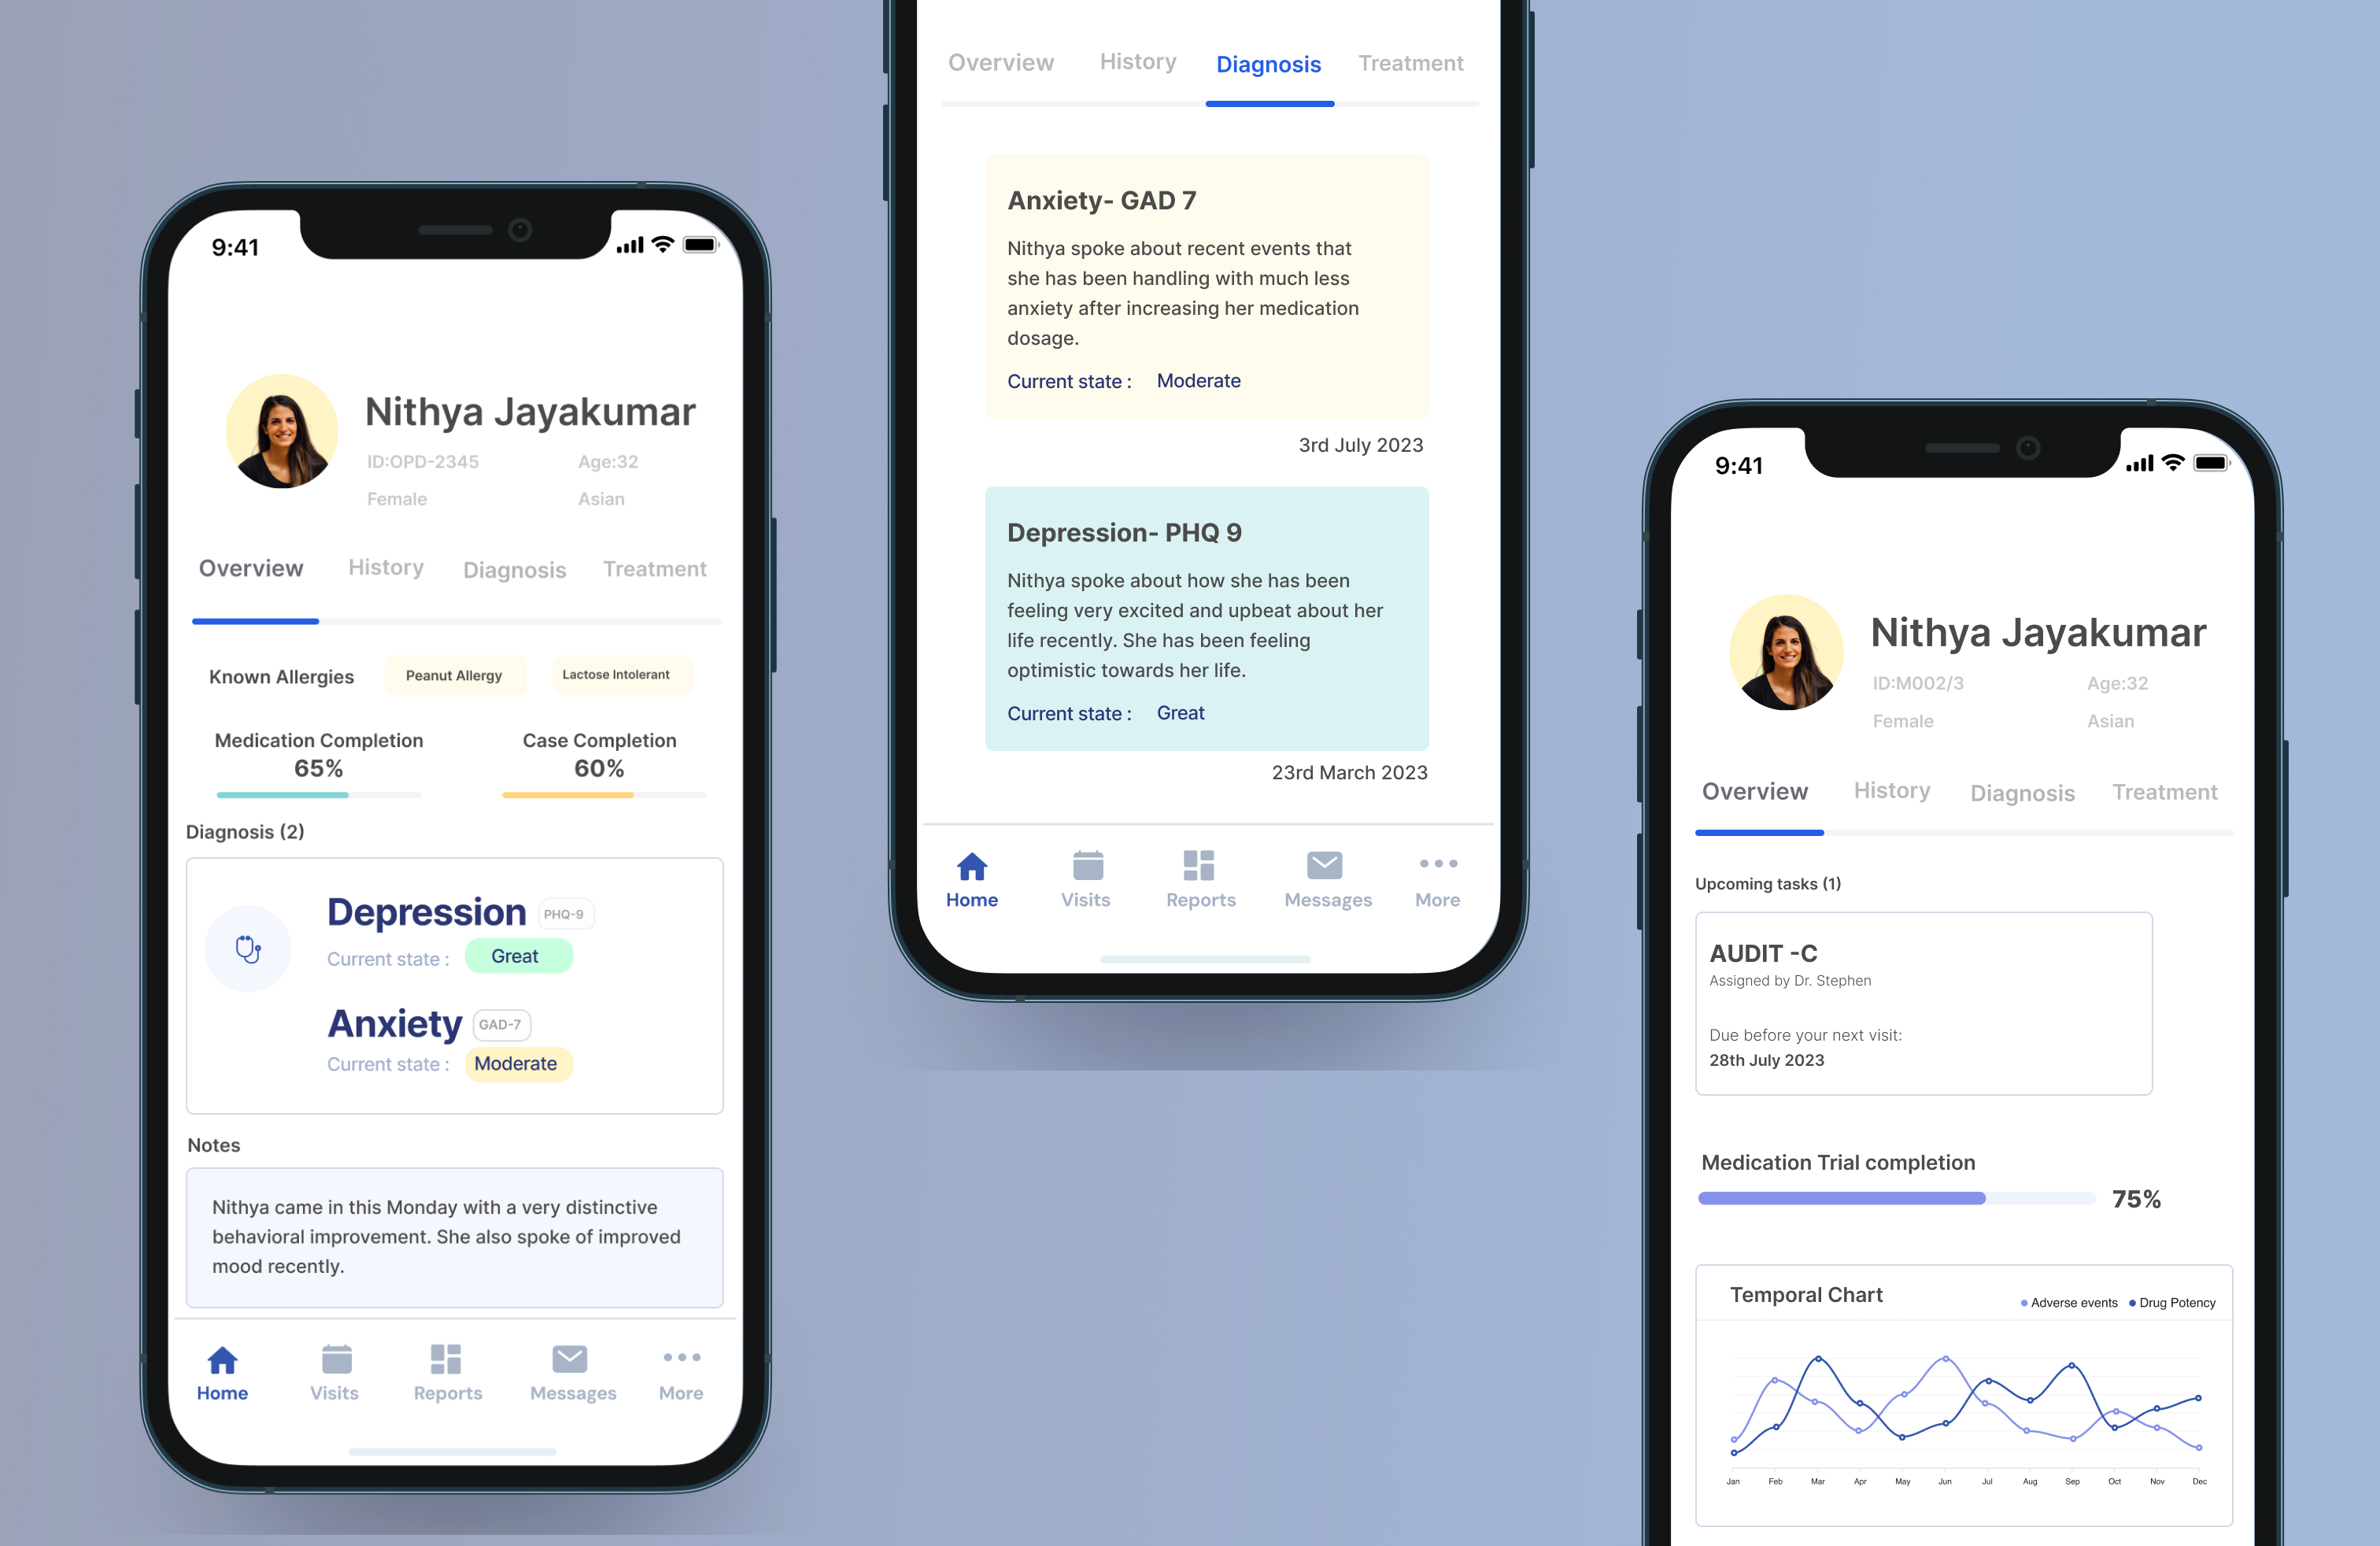
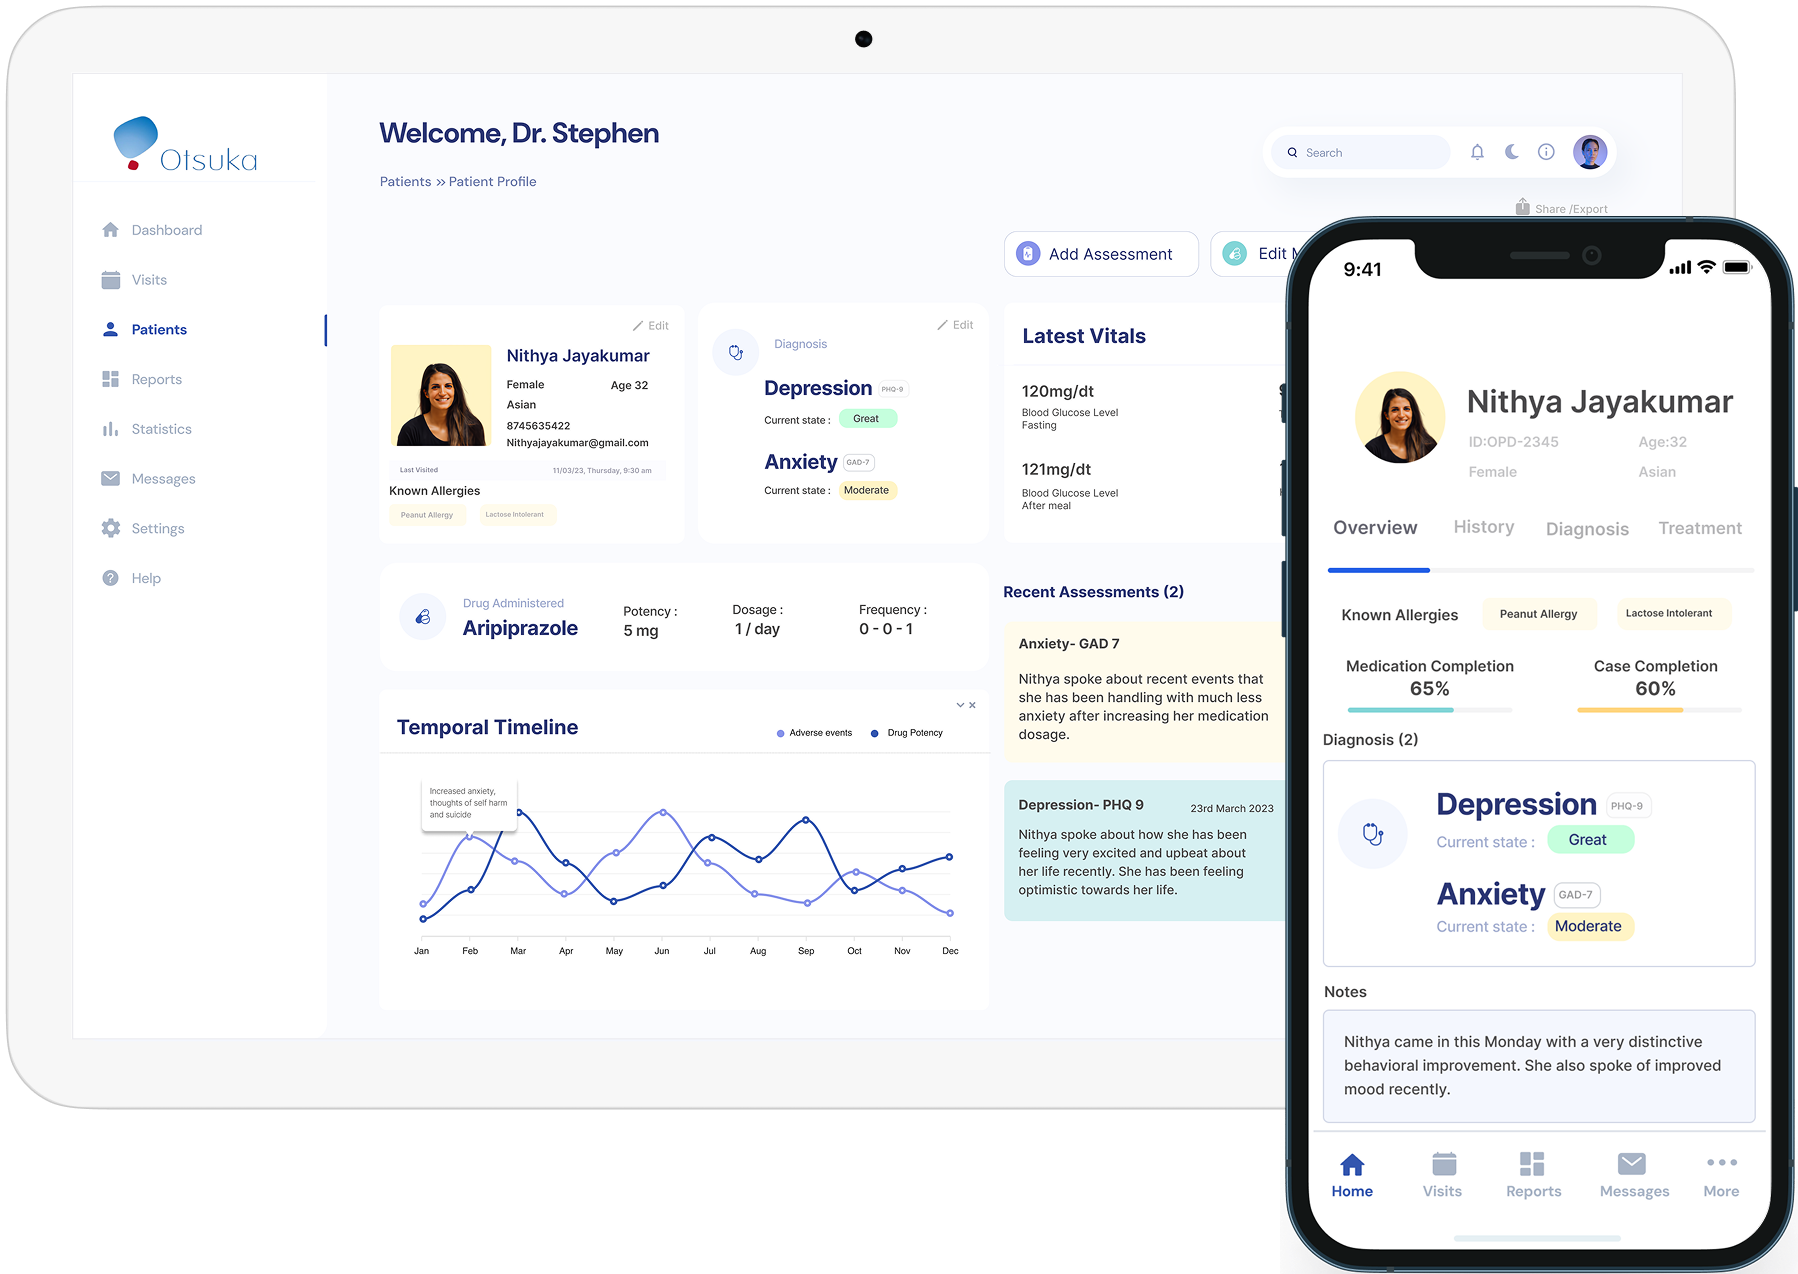
Created low-fidelity wireframes in Figma, focusing on core functionality and usability.Conducted usability testing with stakeholders, refining wireframes based on feedback.Developed high-fidelity prototypes for patient and provider interfaces, emphasizing clarity and accessibility.
Disclaimer: The original design work is confidential and has been modified for portfolio purposes.


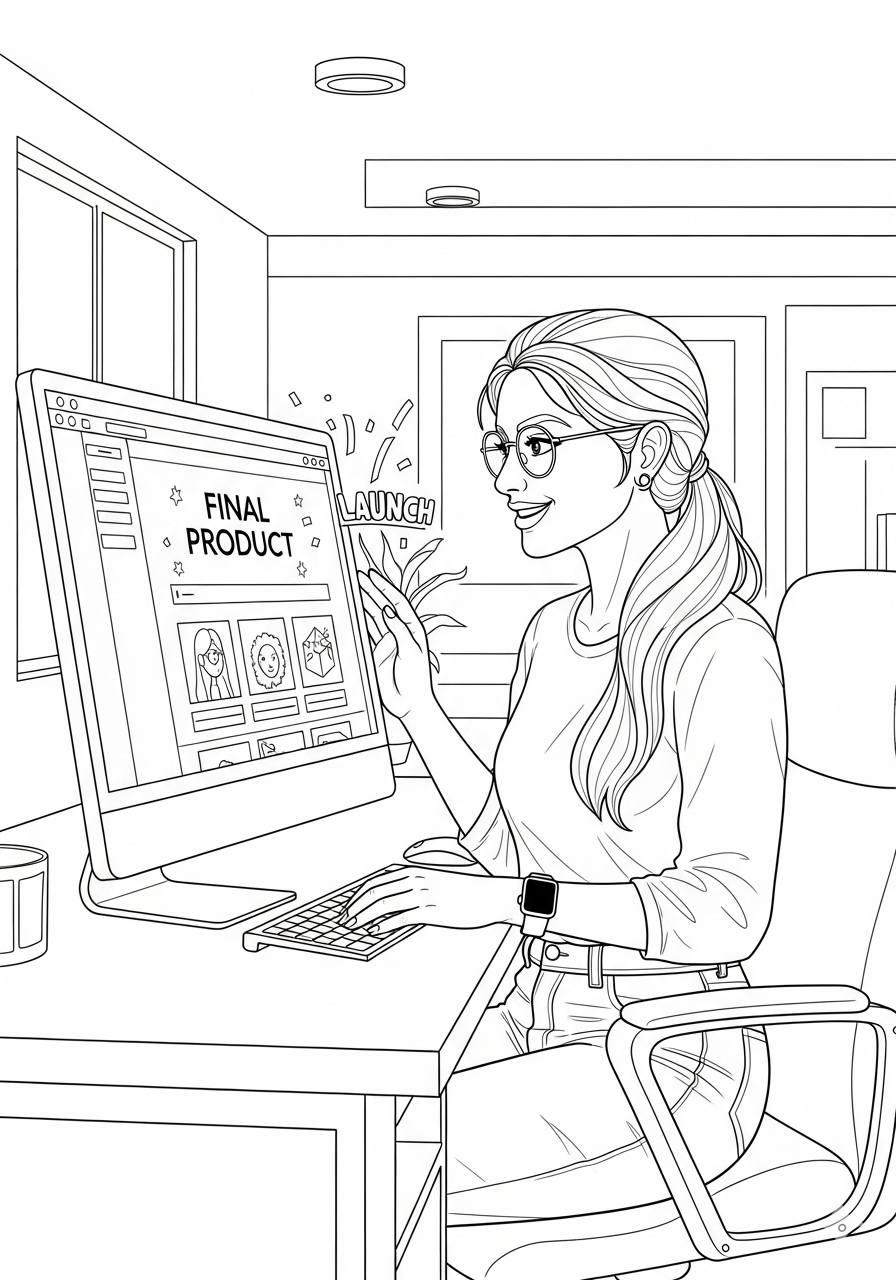
To provide clear and actionable insights, we integrated:

Conducted usability tests with trial participants and medical professionals.
Key Improvements:


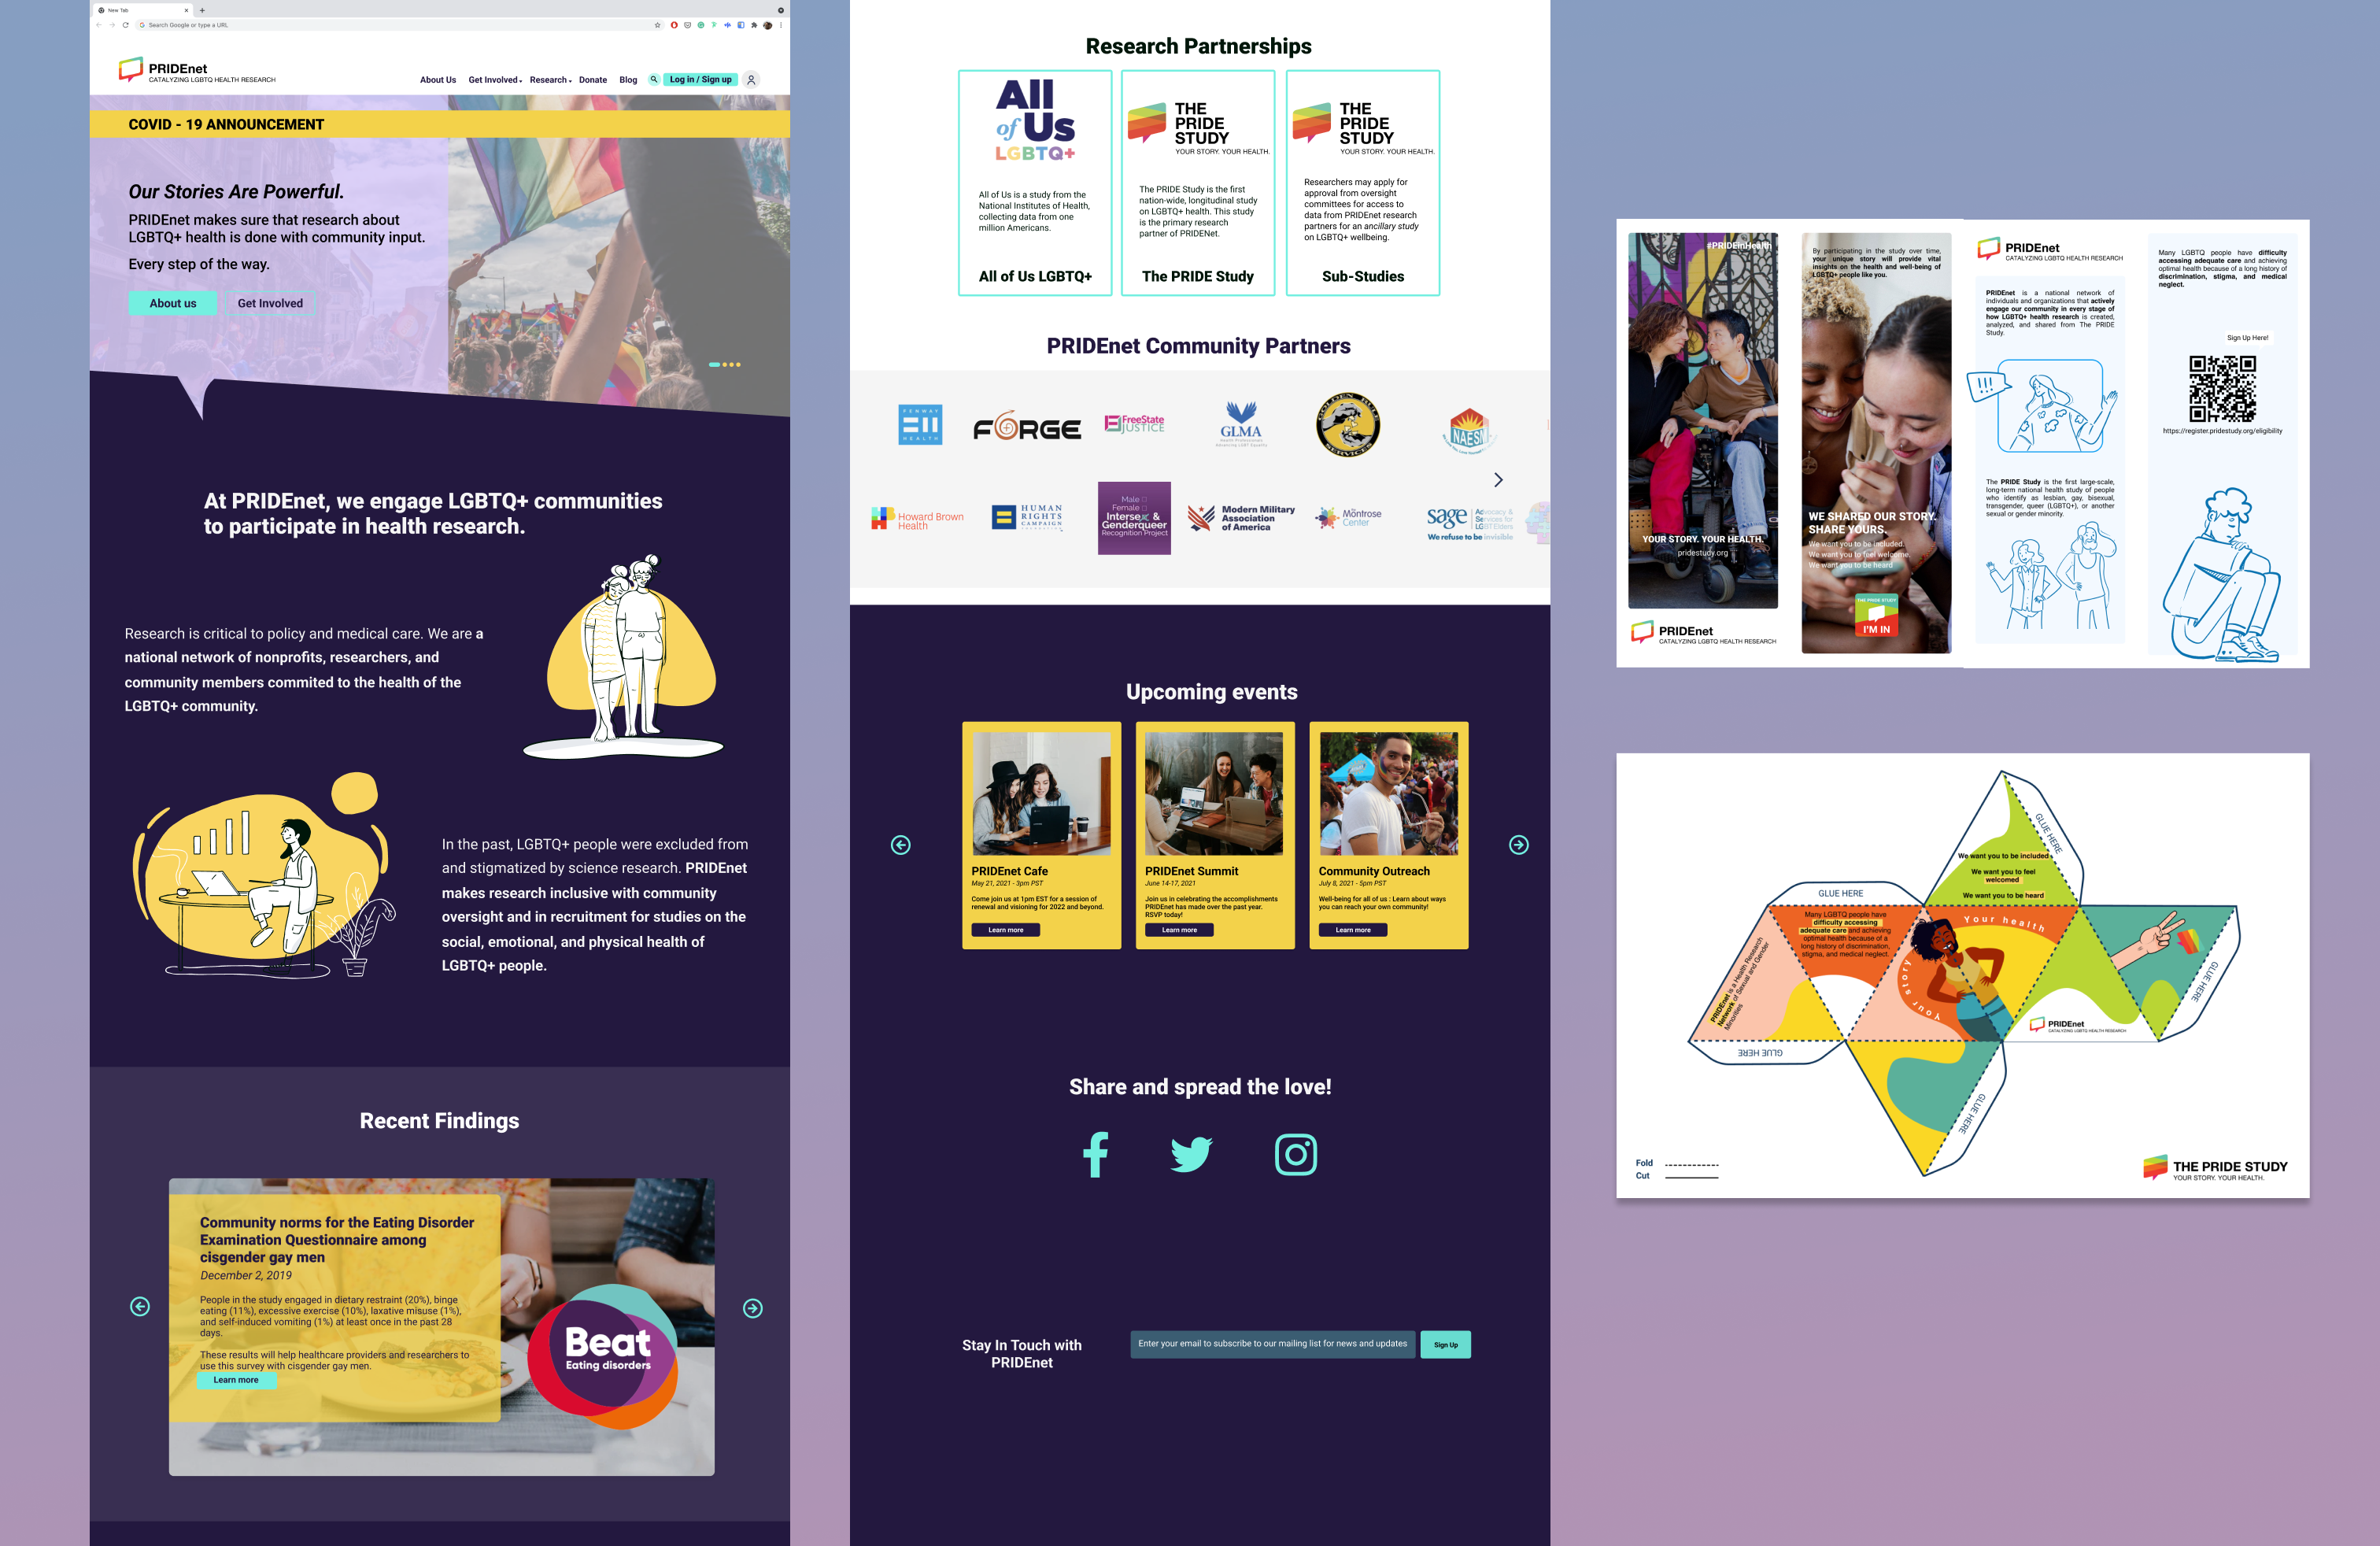
A case study redesigning website for PRIDEnet - the volunteer and community engagement sector of the PRIDE study.

A case study redesigning website for PRIDEnet - the volunteer and community engagement sector of the PRIDE study.
An optimization system for the Data and Analytics Team at Otsuka to track their development Operations activities
The client is a global pharmaceutical company that is committed to developing new treatments in neuroscience like schizophrenia and major depressive disorder (MDD), bipolar disorder, and other neurological and neuropsychiatric conditions, including Alzheimer disease, epilepsy, attention deficit hyperactive disorder, posttraumatic stress disorder, borderline personality disorder, and autism.
Develop a robust data optimization framework for the Data and Analytics Team at Otsuka to standardize their Dashboards and make them more accessible.
Project Manager , Developers (15) Scrum Master, Business Analyst, Data Scientist, Data Tech and Analytic Solution (DTAS) Team,
Global Intelligence Team(GCI)